Washington Poll: Voter Survey Study Results & Analysis
Explore the non-partisan academic survey on registered voters in Washington, conducted by WISER at the Univ. of WA. Detailed results available by email request.

Washington Poll: Voter Survey Study Results & Analysis
E N D
Presentation Transcript
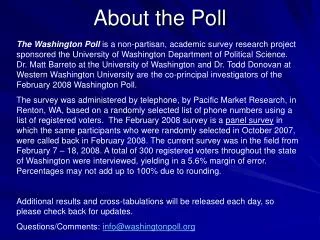
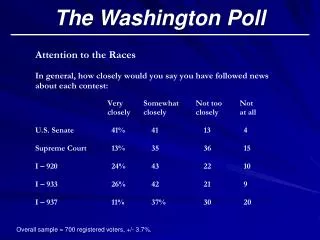
About the Poll The Washington Poll is a non-partisan, academic survey research project sponsored by the Washington Institute for the Study of Ethnicity & Race (WISER), a research center at the University of Washington in the School of Social Sciences. Dr. Gary Segura, a professor of Political Science is the Director of WISER and a co-principal investigator on this survey with Dr. Matt Barreto, also a professor of Political Science. The survey was administered by telephone, by Pacific Market Research, in Renton, WA, based on a randomly selected list of phone numbers using a list of registered voters. The survey was in the field from October 22 – 28, 2007. A total of 601 registered voters throughout the state of Washington were interviewed, yielding in a 4.0% margin of error. Percentages may not add up to 100% due to rounding. Additional results and cross-tabulations will be released each day, so please check back for updates. Questions/Comments: info@washingtonpoll.org
The Washington Poll Among registered voters who reported they have already mailed in their ballot Don’t Refused Yes No Know to answer I – 960 44% 34% 8% 13% R – 67 41% 35% 6% 14% CA – 8206 57% 16% 9% 12% CA – 4204 44% 37% 6% 13% Prop – 1 51% 36% 3% 9% NOTE: sample size of “already voted” is much smaller at 160 with margin of error +/- 7.8%
The Washington Poll Among registered voters who voted in Nov 2005 AND Nov 2006 elections ( i.e. “likely” voters in November 2007 election ) Yes No Undec I – 960 42% 41% 17% R – 67 46% 31% 24% CA – 8206 62% 16% 22% CA – 4204 58% 31% 10% Prop – 1 49% 38% 13% NOTE: 2005/06 vote is based on validated records of Secretary of State statewide voter database Sample size of “already voted” is smaller at 410 with margin of error +/- 4.8%
Additional Results If you have additional questions, and would like to see any additional, or more specific results, please send us an email and we will try to accommodate your request info@washingtonpoll.org