Download
1 / 42
420 likes | 549 Views
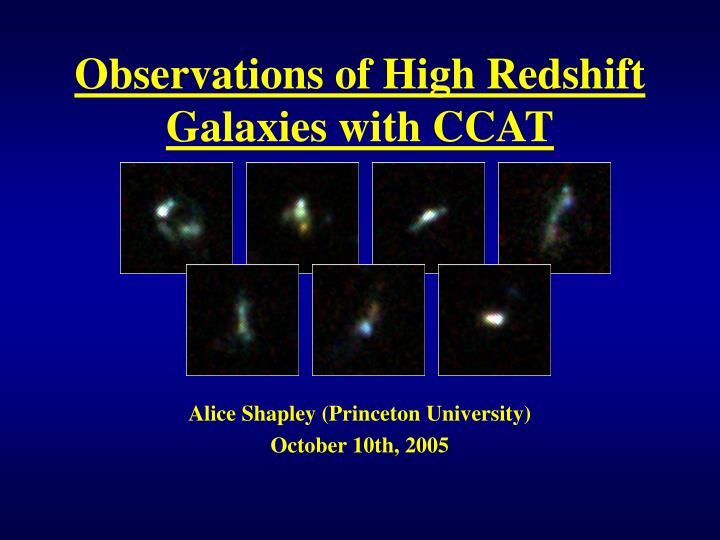
Observations of High Redshift Galaxies with CCAT. Alice Shapley (Princeton University) October 10th, 2005. Overview.

E N D
Observations of High Redshift Galaxies with CCAT Alice Shapley (Princeton University) October 10th, 2005
Overview • CCAT will provide new windows on star formation for sub-ULIRG star-forming galaxies at high redshift, including information about dust, gas content, HII region physical conditions, and star-formation feedback • New results at shorter (optical through mid-IR) wavelengths, CCAT observations will greatly enhance their meaning
New results • Spitzer 24 mm observations provide estimates of Lbol for L~1011-1012 L galaxies (LIRGS) at z~2-3, but this is indirect • M-Z relation, gas fractions in star-forming galaxies at z~2, using optical and near-IR imaging and spectroscopy • Physical conditions appear to be different in high redshift HII regions (z~1-2), based on rest-frame optical emission lines
Relevant Observations with CCAT • submm continuum --> LFIR, Lbol, Tdust • CO lines --> Mgas (molecular, assuming conversion factor), gas fractions, Schmidt law • [CII] 158 mm, [OI] 63 mm, [OIII] 88, 52 mm --> (HII region and ISM physical conditions, densities, cooling) • Different probes of star formation
z>2 color-selection • Adjust z~3 UGR crit. for z~2 (Adelberger et al. 2004) • Spectroscopic follow-up with optimized UV-sensitive setup (Keck I/LRIS-B) (Steidel et al. 2004)
z>2 color-selection • Adjust z~3 UGR crit. for z~2 (Adelberger et al. 2004) • Spectroscopic follow-up with optimized UV-sensitive setup (Keck I/LRIS-B) (Steidel et al. 2004)
Redshift Distributions LBG: z~3 (940) SLBG=1.7/arcmin2 nLBG=1.4x10⁻³Mpc-3 BX: z=2-2.5 (816) SBX=5.2/arcmin2 nBX=2.0x10⁻³ Mpc-3 BM: z=1.5-2.0 (118) SBM=3.8/arcmin2 nBM=1.7x10⁻³Mpc-3 750 gals at z=1.4-2.5 (Steidel et al. 2004; Adelberger et al. 2004) Unsmoothed BX/BM/LBG with R<=25.5
Other surveys & space densities: • K20 (z=1.4-2.5): ~10-4/Mpc3 • GDDS (z=1.6-2.0):~10-4/Mpc3 • SMG (z~2.5): ~10-5 /Mpc3 • FIRES(z=2-3.5): uncertain Redshift Distributions LBG: z~3 (940) SLBG=1.7/arcmin2 nLBG=1.4x10⁻³Mpc-3 BX: z=2-2.5 (816) SBX=5.2/arcmin2 nBX=2.0x10⁻³ Mpc-3 BM: z=1.5-2.0 (118) SBM=3.8/arcmin2 nBM=1.7x10⁻³Mpc-3 750 gals at z=1.4-2.5 (Steidel et al. 2004; Adelberger et al. 2004) Unsmoothed BX/BM/LBG with R<=25.5
Other redshift desert surveys • Other surveys with galaxies at z~1.4-2.5 • K20/BzK (Cimatti et al.) (K<20 selection)(~40) • Gemini Deep Deep (Abraham et al.) (K<20.6, photo-z) (34) • FIRES (Franx, van Dokkum et al.) (J-K selection) (~10) • Radio-selected SMG (Chapman et al.) (73) (+18 OFRG) • Now that there are several groups using different selection techniques to find galaxies at z~2, we need to understand how the samples relate to each other.
Mid-IR Lum. from Spitzer/MIPS • Spitzer/MIPS 24 mm band probes PAH emission at z=1.5-2.6, probe of L5-8mm • Average ratio of L5-8 to LIR is 28.3 for local star-forming galaxies; use this to convert MIPS to bolometric IR luminosities • Optical and near-IR-select gals at z~2 have <LIR>~3-5x10¹¹ L (Reddy et al. 2005)
Mid-IR Lum. Vs. LX(bol) • Using z~2 galaxies in the GOODS-N field, it is possible to do X-ray “stacking” analysis, as a function of L5-8 (10-20 gals per bin) • LX probes bolometric SFR (not AGN) • Strong linear correlation between L5-8 and LX • Evidence that L5-8 is a good SFR indicator (Reddy et al. 2005)
Mid-IR Lum. Vs. LFIR(bol) • Compare LFIR derived from L5-8 with LFIR measured from SCUBA and other sources • For SCUBA/SMG sources, FIR inferred from MIR is low by a factor of ~2-10 (Tdust, AGN) • We need direct comparisons for fainter galaxies (CCAT)!! (Reddy et al. 2005)
Lbol vs. Dust Extinction • Relationship between Lbol and extinction evolves from z~0 to z~3 • Galaxies at fixed extinction are ~100X more luminous (or galaxies at fixed luminosity are less dusty) • Geometry, evolution of dust distribution • Direct Lbol at high-z is critical for this analysis • CCAT will provide this (Tdust, Lbol) (Reddy et al. 2005)
Evolution of Galaxy Metallicities • Gas phase oxygen abundance in star-forming galaxies • Fundamental metric of galaxy formation process, reflects gas reprocessed by stars, metals returned to the ISM by SNe explosions (HII regions in sf-galaxies, stars in early-type). • Departures from closed-box expectations can reveal evidence for outflow/inflow • Galaxies display universal correlations between Luminosity (L), Stellar mass (M), and metallicity (Z) • 10,000s of galaxies in the local universe with O/H • Now the challenge is to obtain these measurements at high redshift (evolution will give clues) • Measuring gas fractions is very important to quantify how much material has been processed into stars -- currently very indirect!!!
Abundance Indicators: Bright (R23) • High-Z branch: R23 decreases as Z increases • Low-Z branch: R23 decreases as Z decreases • Uncertainty in which branch R23 corresponds to • Systematic differences from direct method (Kobulnicky et al. 1999)
Local L-Z Relationship • Lots of local emission line measurements (10000’s, 2dF, Sloan) • At z=0.5-1, 3 groups (>=200 gals, CFRS, DGSS, CADIS, TKRS) • At z>2 there were < 10 measurements (mainly LBGs) • DLAs provide metallicity information from abs lines, but hard to relate (Tremonti et al. 2004)
Local M-Z Relationship • M-Z possibly more fundamental than L-Z relationship • closed box model relates gas fraction and metallicity, according to the yield • SDSS sample revealed lower effective yield in lower mass galaxies • importance of feedback (Tremonti et al. 2004)
Near-IR spectroscopy of z~2 gals • z~2 ideal for measuring several neb lines in JHK • evidence of M-Z relation at z~2, gas fractions are necessary part of interpretation (CCAT)
[NII]/Ha ratios: z~2 metallicities • relationship between [NII]/Ha and O/H • N is mixture of primary and secondary origin • age, ionization, N/O effects, integ. spectra, DIG, AGN • (Pettini & Pagel 2004) N2=log([NII] 6584/Ha) 12+log(O/H)=8.9+0.57xN2 s~0.18, factor of 2.5 in O/H
z~2 M-Z Relationship • New sample of 87 star-forming galaxies at z~2 with both M* and [NII[/Ha (gas phase O/H) measurements • Divide into 6 bins in M* , which increases as you move down • clear increase in [NII]/Ha with increasing M* • M-Z at z~2!! (Erb et al. 2005)
z~2 M-Z Relationship • Evol. Comparison with SDSS, where Z is based on [NII]/Ha (for both samples) • Clear offset in relations --> at fixed stellar mass, z~2 galaxies significantly less metal rich than local gals • Not evolutionary (z~2 probably red&dead by z~0) (Erb et al. 2005)
z~2 M-Z Relationship • Important: measure change of Z with m (gas fraction) • Must estimate Mgas, which we do from SHa, to Ssfr, to Sgas (assuming Schmidt law) • Very indirect! • Low stellar mass objects have much higher m (Erb et al. 2005)
z~2 M-Z Relationship (Erb et al. 2005) • Different models for feedback, using different yields and different outflow rates • Data are best fit by model with super-solar yield and outflow rate greater than SFR (for all masses) • Rate of change of m with metallicity gives evidence for feedback ; m is very important (measure with CCAT, CO lines)
z~2 Physical Conditions • Well-defined sequence in [OIII]/Hb vs. [NII]/Ha in local galaxies (SDSS) (star-formation vs. AGN) • z~2 star-forming galaxies are offset from this locus (as is DRG) • ne, ionization parameter, ionizing spectrum (IMF, star-formation history) • Implications for derived O/H (Erb et al. 2005)
z~1 Physical Conditions • Well-defined sequence in [OIII]/Hb vs. [NII]/Ha in local galaxies (SDSS) (star-formation vs. AGN) • z~1.4 star-forming galaxies are offset from this locus (as is DRG) • ne, ionization parameter, ionizing spectrum (IMF, star-formation history) • Implications for derived O/H (Shapley et al. 2005)
z~2 Physical Conditions • Among K<20 galaxies (brightest 10%), [SII] line ratio indicates high electron density • Inferred electron density is ~1000/cm3, • This is higher than in local HII regions used to calibrate N2 vs. O/H relationship • (Pettini et al. 2005)
Beyond [NII]/Ha: All the lines • Deriving Oxygen Abundance from [NII]/Ha relied on several assumptions • Physical conditions appear different. Observations of full set of lines important for constraining sfr in high redshift objects • GNIRS/Gemini O H O H N (van Dokkum et al. 2005)
Beyond [NII]/Ha: All the lines • FIR [OIII] lines, accessible with CCAT at l>200 mm for z>1.5 • independent probe of HII region physical conditions • [CII] 158 mm line, probes physical conditions in different phase (compare with CII* 1335) O H O H N (van Dokkum et al. 2005)
Summary • New results about dust, star formation, chemical enrichment, and feedback, using optical, near-IR, and mid-IR imaging and spectroscopy • CCAT observations can provide independent measurements of dust, gas, and star-formation rates for these objects, as well as probing physical conditions • Both continuum and line emission measurements will be crucial for physical understanding
Q1700+64: Distribution of M* • Mstar,med=2.0x10¹⁰ Msun • Distributions with and without IRAC data very similar (uncertainties smaller with IRAC data) • Stellar mass density of z~2 BX/MD galaxies is ~108MsunMpc-3 16% of z=0 stellar mass density (Cole et al. 2001) • caveats: IMF, bursts • relate to z~3, evolution (???? Weak constraints) • Better constraints for most massive gals (8%) 6/72 have M*>1011M &contain 50% of the mass (Steidel et al. 2005)
Direct Abundance Determination Z=1/25 Zsun • Use [OIII] 4363/(5007,4959) to get Te, [SII] to get ne • Problem: 4363 weak, even in local low-Z gals; star-forming gals are not very metal-poor--NO HOPE at high redshift • (figure from van Zee 2000)
L-Z relation and evolution • Correlation over 11 mags in MB and factor of 100 in (O/H) (SF gals) • Ellipticals show analogous trend • Fainter gals have higher gas fraction (younger, lower Ssfr); or outflows more important (Garnett 2002) Evolution of L-Z provides clues…
Stellar Populations & Masses • Near/Mid-IR Imaging • Deep J, K imaging with WIRC, Palomar 5-m, to Ks~22.5, J~23.8 • 4 fields, ~420 galaxies with zsp> 1.4 • Spitzer IRAC data in Q1700 field, 3.6, 4.5, 5.4, 8 m • Use for modeling stellar populations, masses Ks (2.15 mm) (Barmby et al. 2004, Steidel et al. 2005)
Stellar Populations & Masses • Near/Mid-IR Imaging • Deep J, K imaging with WIRC, Palomar 5-m, to Ks~22.5, J~23.8 • 4 fields, ~420 galaxies with zsp> 1.4 • Spitzer IRAC data in Q1700 field, 3.6, 4.5, 5.4, 8 m • Use for modeling stellar populations, masses IRAC (4.5 mm) (Barmby et al. 2004, Steidel et al. 2005)
Near-IR spectroscopy of z~2 gals • Ha spectra of 101 z~2 gals KeckII/NIRSPEC • Kinematics: linewidths, Mdyn, some spatially-resolved, tilted lines, compare with stellar masses • Line ratios: HII region metallicities, physical conditions • Ha fluxes: SFRs, compare with UV, models • Offsets between nebular, UV abs and Lya em redshifts -> outflows M*=41011 M K=19.3, J-K=2.3 M*=5109 M
Measuring gas masses at z~1-3 • In addition to filling in huge gap in O/H vs. z, and testing evolution of L-Z relation…. • In simple closed-box chemical evolution models: • Z=y ln (1/m) • m=Mgas/(Mstar+Mgas), y=yield of heavy elements • Using broad-band photometry, fit stellar populations and determine Mstar • Test for the importance of outflows (effective yield)
Measuring O/H at z~1 • At z~1.3-1.4, [NII]/Ha in H-band, [OIII]/Hb in J-band • At z~1, [NII]/Ha in J-band, [OIII]/Hb in NIRSPEC1 band • DEEP2 gals already have [OII] • DEEP2 z-hist from Coil et al. 2004, ~5000 gals, 10% of survey • Statistical O/H sample (50-100) at z=1-1.5
Different Estimates of Dust • b measures dust from UV slope • LFIR/L1600 measures dust from inferred ratio of FIR (based on MIPS) to UV luminosity • Local starbursts show correlation between b and FIR/UV • MIPS implies correlation works for z~2 galaxies on avg. (Reddy et al. 2005)
Does Calzetti Work? • Stack 171 zspec=1.4-2.5 S.F. galaxies (excluding all direct detections, AGN) • 10s detection in X-ray <SFR(Xray)> = 42 Msun/yr • 5s detection in radio <SFR(Radio)>=50Msun/yr (LIRG) • Corresponds to <SFR(1500)> = 8.5 Msun/yr • <A(1500)>= factor of 4.9, very similar to results at z~3, and to inference from UV colors with CSF+Calzetti • K<20 z=1.4-2.5 BX/BM: <SFR(Xray)>=130 Msun/yr (Reddy et al. 2005) Star-forming BzK gals: <SFR(Xray)>=170 Msun/yr (Daddi et al. 2004) Chandra Stack (CDFN 2Ms exposure) (Reddy & Steidel 2004)