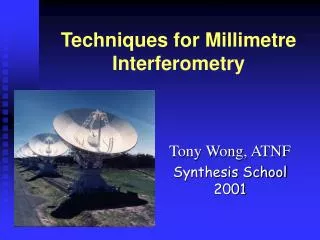
Techniques for Millimetre Interferometry
This document, presented by Tony Wong at the ATNF Synthesis School in 2001, discusses the challenges and instrumental requirements of millimetre-wave interferometry. It covers issues such as phase fluctuations due to atmospheric water vapor, surface accuracy, pointing accuracy, correlator bandwidth, and electronic phase noise. The document also details amplitude calibration methods, the impact of atmospheric conditions on visibility measurements, and phase calibration techniques for reliable data acquisition. Solutions and best practices are highlighted to enhance observational accuracy.

Techniques for Millimetre Interferometry
E N D
Presentation Transcript
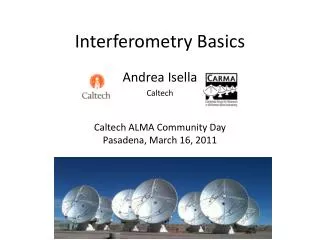
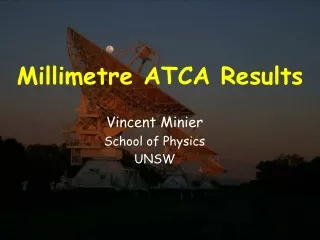
Techniques for Millimetre Interferometry Tony Wong, ATNF Synthesis School 2001
The trouble with mm-waves • More stringent instrumental requirements • Phase fluctuations due to H2O in troposphere • Tropospheric emission/opacity significant H2O O2 O2 H2O R. Sault
Instrumental Challenges 1. Surface accuracy: If s is r.m.s. surface error in m, surface efficiency given by Ruze formula: sf = exp [–(4ps/l)2] For l=3mm and s=200 m, sf=0.54. Antenna “holography” can be used to diagnose large-scale errors in dish shape. 2. Field of view (primary beam size): FWHMl/D 620”/D[m] at 3mm BIMA: D=6.1m, FWHM = 100” ATCA: D=22m, FWHM = 30” For large sources, mosaicing required.
Instrumental Challenges 3. Pointing accuracy: For mosaicing, want typical pointing error < FWHM/20 (14% amplitude error at half power point). Thus need ~1.5” pointing accuracy at ATCA! 4. Correlator bandwidth: 1 MHz lmm km s-1 The same bandwidth covers only 1.4% of the velocity range at 3mm that it does at 21cm! 5. Electronic phase noise: tends to increase with frequency, and hard to calibrate (not antenna-based). For VLA at 22 GHz, rms~10º. 6. Baseline errors: for a source-cal separation of 10º, Db ~ 0.5mm leads to D ~ 10º.
Amplitude Calibration Recall that power is often given in temperature units (K) via the conversion: P = kBT Dn Calibration of the visibility amplitude is typically performed by comparing it with the system temperature, the equivalent noise temperature presented to the detector: Tsys=Trec + Tsky + Tdish + Tsrc 0 0 The sky temperature can be determined via the radiative transfer equation: TsysTrec + Tatm(1-e-t)
Amplitude Calibration In practice, we must correct Tsys for atmospheric absorption in order to estimate what the unattenuated celestial signal would be: Tsys,eff = Tsys et = et [Trec + Tatm(1-e-t)] Example for Trec=150 K, Tatm=290 K: The opacity t at a given frequency depends on the column of precipitable water vapour (PWV).
Chopper Wheel Method The standard method for measuring Tsys,effinvolves measuring the power received from the blank sky, then placing an ambient (295 K) load in front of the receiver (Kutner & Ulich 1981). In both cases the output power is given by Pout = m (Tinp e-t + Tsys) = m e-t (Tinp + Tsys,eff) where m is some scale factor and Tinp is the temperature of a “load” above the atmosphere. For the blank sky measurement, Tinp=TCMB=3 K. For the ambient load measurement, Tinp=Tamb=295 K. (although the load isn’t above the atmosphere, if the atmosphere is also at 295 K, its absorption and emission would cancel anyway)
Chopper Wheel Method Combining the two measurements yields: Hence, subject to the approximation TambTatm, the chopper wheel method gives Tsys,effdirectly even when Tsys and t are not separately known! Regular systemp measurements (every 15 min. or so) are needed to track variations in the receiver gains and atmosphere.
Absolute Flux Calibration Good flux cals are unresolved, bright, and non-varying. But no such objects at mm wavelengths! For planets there are reasonably good models for Tb which can be used, together with angular size, to derive a visibility model. where disk is the angular size of the planet. Usual method: • Observe a planet during your track for 5-10 min. • Bootstrap fluxes of phase calibrator & source using a model for the planet visibility structure.
Absolute Flux Calibration Problem: planets will generally be resolved out by the interferometer.
Absolute Flux Calibration Possible solution: bootstrap in single-dish rather than interferometer mode.
Atmospheric Phase Noise Changes in refractive index of atmosphere due to precipitable water vapor (PWV) lead to “corrugations” in wavefront of an incoming plane wave. Desai 1998
Atmospheric Phase Noise • Atmospheric RMS phase noise (rms) increases with baseline length because turbulence occurs on a range of length scales. Carilli et al. 1999
Atmospheric Phase Noise • Phase noise also increases with frequency because refractive effects are largely non-dispersive (constant in length units). Carilli et al. 1999
Effect on Visibility Data Effect of phase noise on a visibility measurement can be expressed as <V>/V0 = exp (– rms2 / 2) where rms is the RMS phase variation during the averaging time. For rms=1 rad, <V>/V0=0.60 and the visibility amplitude is reduced by 40% due to phase noise (also called decorrelation). Since rms increases with baseline length, visibility amplitude falls off in the outer (u,v) plane, degrading the angular resolution of the map (equivalent to optical “seeing”).
Phase Calibration • Standard technique (phase referencing): observe a point source as phase calibrator every tc~20-30 minutes, then apply interpolated phase gains to source. • Can measure phase variations over timescales > 2tc (Nyquist). • OK for baselines up to ~100 m (looking through similar stuff) but time-averaged phase fluctuations too large on longer baselines. • ATCA baselines range from 30m to 3km – alternative techniques required.
Phase Calibration • If source structure is simple and nbsln > 3, can correct phase on much shorter timescales via self-calibration (limited by S/N ratio). • Otherwise, must switch back to phase calibrator rapidly (every few minutes) – fast switching. • With extra antennas, can observe calibrator continuously using a subarray – paired array. • Can make precise measurements of the water vapor column (PWV), proportional to the phase delay, by measuring H2O lines at 22 or 183 GHz – water vapor radiometry (see Bob Sault’s talk). • In the near term, fast switching will be the preferred method for ATCA.
Effectiveness of fast switching Carilli et al. 1999
Observing a test calibrator In poor weather or when using long baselines, it may be unclear whether a non-detection is due to source weakness or to atmospheric phase decorrelation. Procedure: observe a weaker (but detectable) “test” quasar near your source, in addition to a stronger quasar as the phase calibrator. If phase gains transferred to the test quasar yield a good detection, your phase calibration is probably adequate. Example: observe test quasar instead of source every third cycle (30 sec/cycle). source=m82,0841+708,1048+717 grid=‘ns(1,1,1,2,2,1,1,1,2,2,3,3,3,2,2)’
Instrumental Phase • Phase variations can also result from variable instrumental delays, e.g. diurnal changes in effective cable length. • A roundtrip phase measurement can be used to correct for these delays. Four hours at BIMA
Sample Observing Scheme • Pointing pattern on SiO maser • 9-pt mosaic, 30 sec/point, repeated for 45 min. • Blank sky position serves as OFF for AC data Blank sky Target source Maser (phase cal)
Results for NGC 6334 I(N) blank NE NW E center W SE SW maser Single-baseline ATCA, July 2001
Lecture Summary • Interferometry at high radio frequencies places stringent demands on pointing, surface accuracy, and other instrumental properties. • Amplitude calibration is complicated by varying atmospheric opacity, but can be corrected to first order using the chopper wheel method. • Flux calibration relies on planets because quasars are variable at mm wavelengths. • Phase calibration becomes increasingly difficult at higher frequencies and longer baselines due to turbulence in the tropospheric H2O layer. • Observing programs need to allot adequate time for amplitude, flux, phase, and pointing calibrations in order to minimise map errors.