Download
1 / 49
490 likes | 514 Views
This article discusses Dynamic Causal Modelling (DCM) for studying the relationship between power changes in different brain regions and how slow activity in one region affects faster activity in another.

E N D
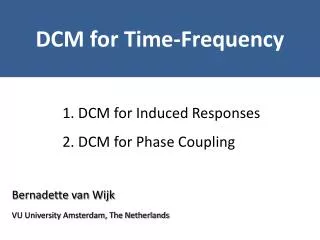
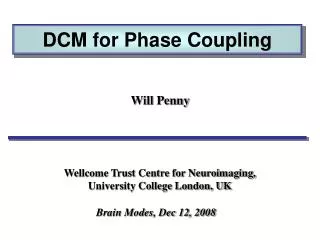
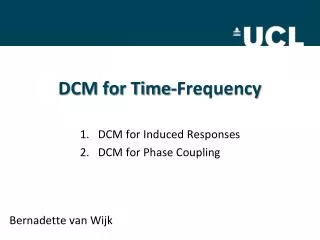
DCM for Time Frequency Will Penny Wellcome Trust Centre for Neuroimaging, University College London, UK SPM MEG/EEG Course, May 11th, 2010
DCM for Induced Responses Region 2 Region 1 ? ? Relate change of power in one region and frequency to power in others. How does slow activity in one region affect fast activity in another ? Region 3
DCM for fMRI Single region u1 c u1 a11 z1 u2 z1 z2
u1 c a11 z1 a21 z2 a22 Multiple regions u1 u2 z1 z2
Modulatory inputs u1 u2 c u1 a11 z1 u2 b21 z1 a21 z2 z2 a22
u1 u2 c u1 a11 z1 u2 b21 a12 z1 a21 z2 z2 a22 Reciprocal connections
DCM for induced responses Single Region dg(t)/dt=Ag(t)+Cu(t) Where g(t) is a K x 1 vector of spectral responses A is a K x K matrix of frequency coupling parameters Diagonal elements of A (linear – within freq) Off diagonal (nonlinear – between freq) Also allow A to be changed by experimental condition
DCM for induced responses • Specify the DCM: • 2 areas (A1 and A2) • 2 frequencies (F and S) • 2 inputs (Ext. and Con.) • Extrinsic and intrinsic coupling Integrate the state equations A1 A2
Linear (within-frequency) coupling Intrinsic (within-source) coupling Extrinsic (between-source) coupling Nonlinear (between-frequency) coupling Differential equation model for spectral energy How frequency K in region j affects frequency 1 in region i
state equation Intrinsic (within-source) coupling é ù é ù é ù x A A B B C & L L 1 11 1 J 11 1 J 1 ê ú ê ú ê ú å = = + + ( W, t ) u ( t ) x ( w , t ) u ( t ) M M O M M O M M ê ú ê ú ê ú ê ú ê ú ê ú x A A B B C & K K ë û ë û ë û J J 1 JJ J 1 JJ J Extrinsic (between-source) coupling Modulatory connections
Neural Mass Models Weak Input Strong Input
Use of Frequency Modes Single Region G=USV’ Where G is a K’ x T spectrogram U is K’xK matrix with K frequency modes V is K’ x T and contains spectral mode responses Hence A is only K x K, not K’ x K’
The “core” system FFA FFA OFA OFA input
FLBL FNBL FNBN FLBN FFA FFA FFA FFA FFA FFA FFA FFA OFA OFA OFA OFA OFA OFA OFA OFA Input Input Input Input Face selective effects modulate within hemisphere forward and backward cxs Forward linear nonlinear nonlinear (and linear) linear FLBL FNBL linear Backward FLNB FNBN nonlinear
Model Inference • Both forward and backward connections are nonlinear FLBL FNBL FLBN *FNBN 1000 backward linear backward nonlinear 0 0 -1000 -10000 -2000 -16306 -16308 -11895 -20000 -3000 -30000 -4000 -5000 -40000 forward linear -6000 forward nonlinear -50000 -7000 -60000 -8000 -59890 -70000
Parameter Inference: gamma affects alpha Left forward – excitatory- activating effect of gamma-alpha coupling in the forward connections During face processing Right backward - inhibitory– suppressive effect of gamma-alpha coupling in backward connections
0.1 0.1 0.08 0.08 0.06 0.06 0.04 0.04 0.02 0.02 0 0 -0.02 -0.02 -0.04 -0.04 Forward Backward Forward Backward -0.06 -0.06 -0.08 -0.08 -0.1 -0.1 Parameter Inference: gamma affects alpha SPM tdf 72; FWHM 7.8 x 6.5 Hz 4 12 20 28 36 44 Frequency (Hz) 44 36 28 20 12 4 From 32 Hz (gamma) to 10 Hz (alpha) t = 4.72; p = 0.002 Left hemisphere Right hemisphere
“Gamma activity in input areas induces slower dynamics in higher areas as prediction error is accumulated. Nonlinear coupling in high-level area induces gamma activity in that higher area which then accelerates the decay of activity in the lower level. This decay is manifest as damped alpha oscillations.” • C.C. Chen , S. Kiebel, KJ Friston , Dynamic causal modelling of induced responses. NeuroImage, 2008; (41):1293-1312. • C.C. Chen, R.N. Henson, K.E. Stephan, J.M. Kilner, and K.J. Friston. Forward and backward connections in the brain: A DCM study of functional asymmetries in face processing. NeuroImage, 2009 Apr 1;45(2):453-62
DCM for Phase Coupling For studying synchronization among brain regions Relate change of phase in one region to phase in others Region 2 Region 1 ? ? Region 3
Bidirectional coupling 0.3 0.3
DCM for Phase Coupling Phase interaction function is an arbitrary order Fourier series
DCM for Phase Coupling Allow connections to depend on experimental condition
MEG Example Fuentemilla et al, Current Biology, 2010
Questions • Duzel et al. find different patterns of theta-coupling in the delay period • dependent on task. • Pick 3 regions based on [previous source reconstruction] • 1. Right MTL [27,-18,-27] mm • 2. Right VIS [10,-100,0] mm • 3. Right IFG [39,28,-12] mm • Fit models to control data (10 trials) and memory data (10 trials). Each trial • comprises first 1sec of delay period. • Find out if structure of network dynamics is Master-Slave (MS) or • (Partial/Total) Mutual Entrainment (ME) • Which connections are modulated by memory task ?
Data Preprocessing • Source reconstruct activity in areas of interest (with fewer sources than • sensors and known location, then pinv will do; Baillet 01) • Bandpass data into frequency range of interest • Hilbert transform data to obtain instantaneous phase • Use multiple trials per experimental condition
MTL Master VIS Master IFG Master 1 IFG 3 5 VIS IFG VIS IFG VIS Master- Slave MTL MTL MTL IFG 6 VIS 2 IFG VIS 4 IFG VIS Partial Mutual Entrainment MTL MTL MTL 7 IFG VIS Total Mutual Entrainment MTL
LogEv Model
0.77 2.46 IFG VIS 0.89 2.89 MTL
Control fIFG-fVIS fMTL-fVIS
Memory fIFG-fVIS fMTL-fVIS
Recordings from rats doing spatial memory task: Jones and Wilson, PLoS B, 2005
Hippocampus Septum Connection to Neurobiology: Septo-Hippocampal theta rhythm Denham et al. 2000: Wilson-Cowan style model
Hippocampus Septum Hopf Bifurcation A B A B
For a generic Hopf bifurcation (Erm & Kopell…) See Brown et al. 04, for PRCs corresponding to other bifurcations
Connection to Neural Mass Models First and Second order Volterra kernels From Neural Mass model. Strong (saturating) input leads to cross-frequency coupling