Download

1 / 46
460 likes | 567 Views
The Heart Protection Study investigated the effects of vitamin supplementation and statin therapy on vascular disease outcomes. Participants aged 40-80 with prior coronary heart disease (CHD), diabetes, or hypertension were analyzed for cholesterol levels and major vascular events. The study found that while vitamin regimens increased blood vitamin levels, they did not significantly reduce risks of vascular events or cancer. Statins showed considerable efficacy, yet ongoing vitamin supplementation appears challenging to justify based on these findings.

E N D
ELIGIBILITY: MRC/BHF Heart Protection Study • Increased risk of CHD death due to prior disease: • Myocardial infarction or other coronary heart disease; • Occlusive disease of non-coronary arteries; or • Diabetes mellitus or treated hypertension • Age 40-80 years • Total cholesterol 3.5 mmol/l ( 135mg/dl) • Statin or vitamins not considered clearly indicated or contraindicated by patient’s own doctors
VITAMINS: CAUSE-SPECIFIC MORTALITY Cause of VITAMINS PLACEBO Rate ratio & 95% CI death (10269) (10267) VITAMINS better PLACEBO better Vascular Coronary 664 630 Other vascular 214 210 ANY VASCULAR 878 840 5% SE 5 increase (8.6%) (8.2%) (NS) Non-vascular Neoplastic 359 345 Respiratory 103 101 Other medical 90 82 Non-medical 16 21 NON-VASCULAR 568 549 4% SE 6 increase (5.5%) (5.3%) (NS) ALL CAUSES 1446 1389 4% SE 4 increase (14.1%) (13.5%) (NS) 0.4 0.6 0.8 1.0 1.2 1.4
VITAMINS: SITE-SPECIFIC CANCER INCIDENCE VITAMINS PLACEBO Rate ratio & 95% CI (10269) (10267) VITAMINS better PLACEBO better Gastrointestinal 228 223 Respiratory 181 165 Connective tissue 60 68 Genitourinary 247 284 Central nervous system 11 8 Haematological 58 58 Other 3 5 Not specified 42 43 ANY CANCER (except 800 817 2% SE 5 non melanoma skin) reduction (7.8%) (8.0%) (NS) Non-melanoma skin 217 228 0.4 0.6 0.8 1.0 1.2 1.4
VITAMINS: STROKE INCIDENCE VITAMINS PLACEBO Rate ratio & 95% CI (10269) (10267) VITAMINS better PLACEBO better Type Ischaemic 345 354 Haemorrhagic 51 53 Unknown 122 115 Severity Fatal 108 107 Severe 50 43 Moderate 127 135 Mild 158 169 Unknown 68 64 ALL STROKES 511 518 1% SE 6 reduction (5.0%) (5.0%) (NS) 0.4 0.6 0.8 1.0 1.2 1.4
VITAMINS: CORONARY EVENTS & REVASCULARISATION VITAMINS PLACEBO Rate ratio & 95% CI (10269) (10267) VITAMINS better PLACEBO better Major coronary event Non-fatal MI 464 467 Coronary death 664 630 CORONARY EVENTS 1063 1047 2% SE 4 increase (10.4%) (10.2%) (NS) Revascularisation Coronary 623 615 Non-coronary 472 510 REVASCULARISATIONS 1058 1086 3% SE 4 reduction (10.3%) (10.6%) (NS) 0.4 0.6 0.8 1.0 1.2 1.4
VITAMINS: MAJOR VASCULAR EVENTS Vascular VITAMINS PLACEBO Rate ratio & 95% CI event (10269) (10267) VITAMINS better PLACEBO better Major coronary 1063 1047 Any stroke 511 518 Revascularisation 1058 1086 ANY OF ABOVE 2306 2312 0% SE 3 reduction (22.5%) (22.5%) (NS) 0.4 0.6 0.8 1.0 1.2 1.4
VITAMINS: MAJOR VASCULAR EVENT by PRIOR DISEASE VITAMINS PLACEBO Rate ratio & 95% CI (10269) (10267) VITAMINS better PLACEBO better Previous MI 1155 1094 Other CHD (not MI) 501 550 No prior CHD CVD 190 194 PVD 376 371 Diabetes 311 332 ALL PATIENTS 2306 2312 0% SE 3 reduction (22.5%) (22.5%) (NS) 0.4 0.6 0.8 1.0 1.2 1.4
VITAMINS: MAJOR VASCULAR EVENT by YEAR Year of VITAMINS PLACEBO Rate ratio & 95% CI follow-up (10269) (10267) VITAMINS better PLACEBO better 1 494 (4.8%) 514 (5.0%) 2 466 (4.8%) 449 (4.6%) 3 456 (5.0%) 412 (4.5%) 4 379 (4.4%) 388 (4.5%) 5+ 511 (6.3%) 549 (6.7%) ALL FOLLOW-UP 2306 (22.5%) 2312 (22.5%) 0% SE 3 reduction (NS) 0.4 0.6 0.8 1.0 1.2 1.4
VITAMINS: MAJOR VASCULAR EVENT by YEAR 30 25 PLACEBO 20 15 VITAMINS 10 5 0 0 1 2 3 4 5 6 Years of follow-up 2(3) 0(4) -4(5) -3(5) 4(8) People suffering events (%) Benefit/1000 (SE): 2(18) VITAMINS
VITAMINS: COGNITIVE IMPAIRMENT(TICS-m <22/39) at Final Follow-up
VITAMINS: Summary of findings • This antioxidant vitamin regimen (600mg E, 250mg C & 20mg beta carotene daily) increased blood vitamin levels substantially • These vitamins appeared to be safe, but did not reduce the 5-year risks of any type of vascular disease, cancer or other major outcome • Given these results, continued recommendation of supplementation with such vitamins is difficult to justify
STATIN USE: Compliance with study simvastatin or use of non-study statin
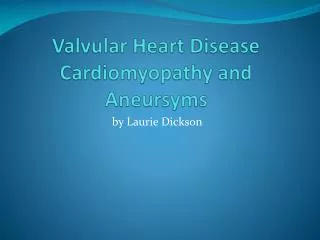
Difference in LDL CHOLESTEROL (SIMVASTATIN - PLACEBO) 20 0.5 mmol/l Years of follow-up mg/dl (±SE) (±SE) 1 2 3 4 5 0.0 0 -0.5 -20 -1.0 -40 -1.5 -60 Average: - 1.0 ± 0.02 mmol/l -2.0 - 37 ± 0.8 mg/dl -80
HPS assesses 2/3 of the effect of actually using 40mg simvastatin daily • Average proportions using statin during HPS: 5/6 of active group vs 1/6 of control group • LDL difference in HPS (active vs control group) is ~2/3 of LDL difference from actually using statin • Risk reduction in HPS (active vs control group) is ~2/3 of risk reduction from actually using statin • ACTUAL EFFECT = 1.5 x APPARENT EFFECT
SIMVASTATIN: CAUSE-SPECIFIC MORTALITY Cause of SIMVASTATIN PLACEBO Rate ratio & 95% CI death (10269) (10267) STATIN better PLACEBO better Vascular Coronary 587 707 Other vascular 194 230 ANY VASCULAR 781 937 17% SE 4 reduction (7.6%) (9.1%) (2P<0.0001) Non-vascular Neoplastic 359 345 Respiratory 90 114 Other medical 82 90 Non-medical 16 21 NON-VASCULAR 547 570 5% SE 6 reduction (5.3%) (5.6%) (NS) ALL CAUSES 1328 1507 13% SE 4 reduction (12.9%) (14.7%) (2P<0.001) 0.4 0.6 0.8 1.0 1.2 1.4
SIMVASTATIN: SITE-SPECIFIC CANCER INCIDENCE SIMVASTATIN PLACEBO Rate ratio & 95% CI (10269) (10267) STATIN better PLACEBO better Gastrointestinal 228 223 Respiratory 179 167 Connective tissue 60 68 Genitourinary 259 272 Central nervous system 12 7 Haematological 64 52 Other 6 2 Not specified 36 49 ANY CANCER (except 814 803 0% SE 5 non melanoma skin) increase (7.9%) (7.8%) (NS) Non-melanoma skin 243 202 0.4 0.6 0.8 1.0 1.2 1.4
SIMVASTATIN: STROKE INCIDENCE SIMVASTATIN PLACEBO Rate ratio & 95% CI (10269) (10267) STATIN better PLACEBO better Type Ischaemic 290 409 Haemorrhagic 51 53 Unknown 103 134 Severity Fatal 96 119 Severe 42 51 Moderate 107 155 Mild 138 189 Unknown 61 71 ALL STROKES 444 585 25% SE 5 reduction (4.3%) (5.7%) (2P<0.00001) 0.4 0.6 0.8 1.0 1.2 1.4
SIMVASTATIN: CORONARY EVENTS & REVASCULARISATION SIMVASTATIN PLACEBO Rate ratio & 95% CI (10269) (10267) STATIN better PLACEBO better Major coronary event Non-fatal MI 357 574 Coronary death 587 707 CORONARY EVENTS 898 1212 27% SE 4 reduction (8.7%) (11.8%) (2P<0.00001) Revascularisation Coronary 513 725 Non-coronary 450 532 REVASCULARISATIONS 939 1205 24% SE 4 reduction (9.1%) (11.7%) (2P<0.00001) 0.4 0.6 0.8 1.0 1.2 1.4
SIMVASTATIN: MAJOR VASCULAR EVENTS Vascular SIMVASTATIN PLACEBO Rate ratio & 95% CI event (10269) (10267) STATIN better PLACEBO better Major coronary 898 1212 Any stroke 444 585 Revascularisation 939 1205 ANY OF ABOVE 2033 2585 24% SE 3 reduction (19.8%) (25.2%) (2P<0.00001) 0.4 0.6 0.8 1.0 1.2 1.4
SIMVASTATIN: MAJOR VASCULAR EVENT by YEAR Year of SIMVASTATIN PLACEBO Rate ratio & 95% CI follow-up (10269) (10267) STATIN better PLACEBO better 1 481 (4.7%) 527 (5.1%) 2 377 (3.9%) 538 (5.6%) 3 359 (3.9%) 509 (5.6%) 4 331 (3.8%) 436 (5.2%) 5+ 485 (5.8%) 575 (7.3%) ALL FOLLOW-UP 2033 (19.8%) 2585 (25.2%) 24% SE 3 reduction (2P<0.00001) 0.4 0.6 0.8 1.0 1.2 1.4
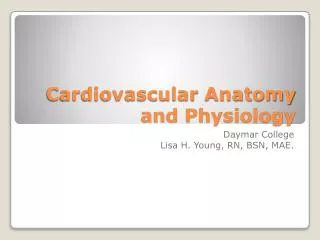
SIMVASTATIN: MAJOR VASCULAR EVENT by YEAR 30 25 PLACEBO 20 15 SIMVASTATIN 10 5 0 0 1 2 3 4 5 6 Years of follow-up 5(3) 20(4) 35(5) 46(5) 54(7) People suffering events (%) Benefit/1000 (SE): 60(18) SIMVASTATIN
SIMVASTATIN: MAJOR VASCULAR EVENT by PRIOR DISEASE SIMVASTATIN PLACEBO Rate ratio & 95% CI (10269) (10267) STATIN better PLACEBO better Previous MI 999 (23.5%) 1250 (29.4%) Other CHD (not MI) 460 (18.9%) 591 (24.2%) No prior CHD CVD 172 (18.7%) 212 (23.6%) PVD 327 (24.7%) 420 (30.5%) Diabetes 276 (13.8%) 367 (18.6%) ALL PATIENTS 2033 (19.8%) 2585 (25.2%) 24% SE 3 reduction (2P<0.00001) 0.4 0.6 0.8 1.0 1.2 1.4
SIMVASTATIN: MAJOR VASCULAR EVENT by AGE & SEX Baseline SIMVASTATIN PLACEBO Rate ratio & 95% CI feature (10269) (10267) STATIN better PLACEBO better Age < 65 831 (16.9%) 1091 (22.1%) 65 - 69 512 (20.9%) 665 (27.2%) 70 - 74 548 (23.8%) 620 (27.7%) ³ 75 142 (23.1%) 209 (32.3%) Sex Male 1666 (21.6%) 2135 (27.6%) Female 367 (14.4%) 450 (17.7%) ALL PATIENTS 2033 (19.8%) 2585 (25.2%) 24% SE 3 reduction (2P<0.00001) 0.4 0.6 0.8 1.0 1.2 1.4
SIMVASTATIN: COGNITIVE IMPAIRMENT(TICS-m <22/39) at Final Follow-up
SIMVASTATIN: MAJOR VASCULAR EVENT by SMOKING & TREATED HYPERTENSION Baseline SIMVASTATIN PLACEBO Rate ratio & 95% CI feature (10269) (10267) STATIN better PLACEBO better Smoking Never regular 406 (15.7%) 531 (20.6%) Ex-cigarette 1298 (20.8%) 1638 (26.3%) Current 329 (22.8%) 416 (28.4%) Treated hypertension Yes 942 (22.4%) 1195 (28.1%) No 1091 (18.0%) 1390 (23.1%) ALL PATIENTS 2033 (19.8%) 2585 (25.2%) 24% SE 3 reduction (2P<0.00001) 0.4 0.6 0.8 1.0 1.2 1.4
SIMVASTATIN: MAJOR VASCULAR EVENT by HDL CHOLESTEROL & TRIGLYCERIDES Lipid levels SIMVASTATIN PLACEBO Rate ratio & 95% CI at entry (10269) (10267) STATIN better PLACEBO better HDL cholesterol (mmol/l) < 0.9 (35 mg/dl) 818 (22.6%) 1064 (29.9%) ³ 0.9 < 1.1 560 (20.0%) 720 (25.1%) ³ 1.1 (43 mg/dl) 655 (17.0%) 801 (20.9%) Triglycerides (mmol/l) < 2.0 (177 mg/dl) 1101 (18.3%) 1432 (23.7%) ³ 2.0 < 4.0 743 (21.6%) 939 (27.3%) ³ 4.0 (354 mg/dl) 189 (23.2%) 214 (27.1%) ALL PATIENTS 2033 (19.8%) 2585 (25.2%) 24% SE 3 reduction (2P<0.00001) 0.4 0.6 0.8 1.0 1.2 1.4
SIMVASTATIN: Average LDL DIFFERENCE(mmol/l ± se) by BASELINE LDL cholesterol
SIMVASTATIN: Average LDL DIFFERENCE (mg/dl ± se) by BASELINE LDL cholesterol
SIMVASTATIN: MAJOR VASCULAR EVENT by LDL & TOTAL CHOLESTEROL Lipid levels SIMVASTATIN PLACEBO Rate ratio & 95% CI at entry (10269) (10267) STATIN better PLACEBO better LDL cholesterol (mmol/l) < 3.0 (116 mg/dl) 598 (17.6%) 756 (22.2%) ³ 3.0 < 3.5 484 (19.0%) 646 (25.7%) ³ 3.5 (135 mg/dl) 951 (22.0%) 1183 (27.2%) Total cholesterol (mmol/l) < 5.0 (193 mg/dl) 360 (17.7%) 472 (23.1%) ³ 5.0 < 6.0 744 (18.9%) 964 (24.5%) > 6.0 (323 mg/dl) 929 (21.6%) 1149 (26.8%) ALL PATIENTS 2033 (19.8%) 2585 (25.2%) 24% SE 3 reduction (2P<0.00001) 0.4 0.6 0.8 1.0 1.2 1.4
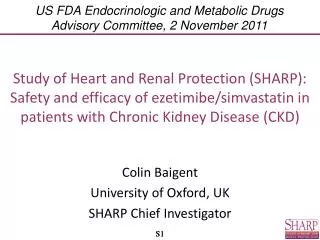
Statin-allocated Placebo-allocated Upper LDL third Lower LDL third SIMVASTATIN: MAJOR VASCULAR EVENT in upper & lower thirds of baseline LDL 30 25 % with major vascular events 20 15 1.5 2.0 2.5 3.0 3.5 4.0 Average LDL cholesterol (mmol/l)
SIMVASTATIN: MAJOR VASCULAR EVENT by LDL CHOLESTEROL Lipid levels SIMVASTATIN PLACEBO Rate ratio & 95% CI at entry (10269) (10267) STATIN better PLACEBO better LDL cholesterol (mg/dl) < 100 282 (16.4%) 358 (21.0%) ³ 100 < 130 668 (18.9%) 871 (24.7%) ³ 130 1083 (21.6%) 1356 (26.9%) ALL PATIENTS 2033 (19.8%) 2585 (25.2%) 24% SE 3 reduction (2P<0.00001) 0.4 0.6 0.8 1.0 1.2 1.4
SIMVASTATIN: MAJOR VASCULAR EVENT by CREATININE & VITAMINS Baseline SIMVASTATIN PLACEBO Rate ratio & 95% CI feature (10269) (10267) STATIN better PLACEBO better Creatinine Normal 1851 (19.2%) 2317 (24.2%) Elevated 182 (28.2%) 268 (39.2%) Vitamin allocation Vitamins 1014 (19.7%) 1292 (25.2%) Placebo 1019 (19.8%) 1293 (25.2%) ALL PATIENTS 2033 (19.8%) 2585 (25.2%) 24% SE 3 reduction (2P<0.00001) 0.4 0.6 0.8 1.0 1.2 1.4
SIMVASTATIN: MAJOR VASCULAR EVENT by OTHER TREATMENT Baseline SIMVASTATIN PLACEBO Rate ratio & 95% CI treatment (10269) (10267) STATIN better PLACEBO better Aspirin Yes 1370 (21.1%) 1784 (27.4%) No 663 (17.5%) 801 (21.3%) ACE inhibitor Yes 495 (24.9%) 568 (28.5%) No 1538 (18.6%) 2017 (24.4%) Beta-blocker Yes 519 (19.5%) 705 (26.9%) No 1514 (19.9%) 1880 (24.6%) Calcium antagonist Yes 788 (24.7%) 1023 (31.2%) No 1245 (17.6%) 1562 (22.4%) ALL PATIENTS 2033 (19.8%) 2585 (25.2%) 24% SE 3 reduction (2P<0.00001) 0.4 0.6 0.8 1.0 1.2 1.4
SIMVASTATIN: Main conclusions • After allowance for non-compliance, 40mg daily simvastatin safely reducesthe risk of heart attack, of stroke, and of revascularisation by about one-third • 5 years of statin treatment typically prevents these “major vascular events” in about: • 100 of every 1000 people with previous MI • 80 " " " other CHD • 70 " " " cerebrovascular disease • 70 " " " other arterial disease • 70 " " " diabetes (age 40+) • irrespective of cholesterol level(or age, or sex, or other treatments)