Download
1 / 23
230 likes | 365 Views
Development of tools for dynamic monitoring of insect populations. Mariano P. Grilli (CREAN) Raquel M. Gleiser (CREAN). Objective. We proposed to develop tools to assess adequate environmental conditions for insect development based on satellite imagery products.

E N D
Development of tools for dynamic monitoring of insect populations Mariano P. Grilli (CREAN)Raquel M. Gleiser (CREAN)
Objective • We proposed to develop tools to assess adequate environmental conditions for insect development based on satellite imagery products.
Development of a tool for dynamic monitoring of an agricultural insect vector in Córdoba – Argentina Mariano P. Grilli
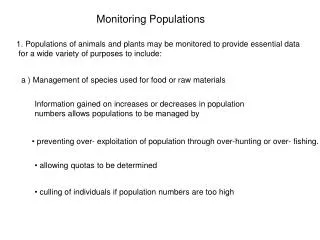
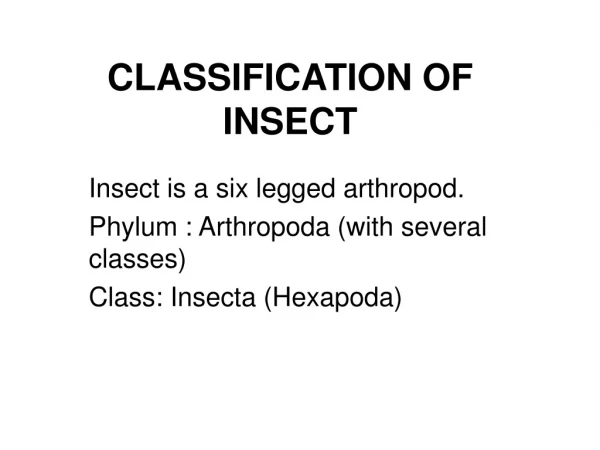
Just to remember… • Planthoppers are vectors of a virus that affects Maize crops causing economic looses in maize production in Argentina • Breeds in winter pastures but not in maize • Short time window for effectively transmiting the virus
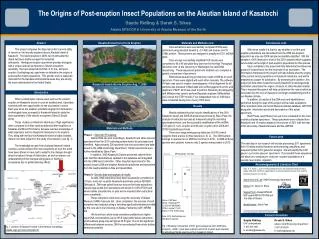
Objective • The objective of the application is to generate a dynamic map of the relative abundance of the vector in Rio Cuarto Department in Córdoba Province.
Resample of Rio Cuarto DepartmentArea Apply a Masktoleaveonly NDVI Valuesinside Rio Cuarto Department NDVI =DN*0.004-0.10 NDVI Digital NumberMap of South America Rescaled NDVI Map of South America NDVI Mapinside Rio Cuarto Department NDVI Map of theStudyArea MapListincludingallthe PHA Maps PHA=8.974*NDVI-3.7481 PlanthopperAbundanceMap (PHA) Rescaled PHA Map DisplayMapList of PHA GenerateHotspotsMaps and includethem in a new MapList Rescale PHA Mapextractingnegativevalues DisplayHotspotsMapList Final HotspotfrequencyMap SumHotspotstogenerate a Final Map
Resample of Rio Cuarto DepartmentArea Apply a Masktoleaveonly NDVI Valuesinside Rio Cuarto Department NDVI =DN*0.004-0.10 NDVI Digital NumberMap of South America Rescaled NDVI Map of South America NDVI Mapinside Rio Cuarto Department NDVI Map of theStudyArea MapListincludingallthe PHA Maps PHA=8.974*NDVI-3.7481 PlanthopperAbundanceMap (PHA) Rescaled PHA Map DisplayMapList of PHA GenerateHotspotsMaps and includethem in a new MapList Rescale PHA Mapextractingnegativevalues DisplayHotspotsMapList Final HotspotfrequencyMap SumHotspotstogenerate a Final Map
Resample of Rio Cuarto DepartmentArea Apply a Masktoleaveonly NDVI Valuesinside Rio Cuarto Department NDVI =DN*0.004-0.10 NDVI Digital NumberMap of South America Rescaled NDVI Map of South America NDVI Mapinside Rio Cuarto Department NDVI Map of theStudyArea MapListincludingallthe PHA Maps PHA=8.974*NDVI-3.7481 PlanthopperAbundanceMap (PHA) Rescaled PHA Map DisplayMapList of PHA GenerateHotspotsMaps and includethem in a new MapList Rescale PHA Mapextractingnegativevalues DisplayHotspotsMapList Final HotspotfrequencyMap SumHotspotstogenerate a Final Map
Resample of Rio Cuarto DepartmentArea Apply a Masktoleaveonly NDVI Valuesinside Rio Cuarto Department NDVI =DN*0.004-0.10 NDVI Digital NumberMap of South America Rescaled NDVI Map of South America NDVI Mapinside Rio Cuarto Department NDVI Map of theStudyArea MapListincludingallthe PHA Maps PHA=8.974*NDVI-3.7481 PlanthopperAbundanceMap (PHA) Rescaled PHA Map DisplayMapList of PHA GenerateHotspotsMaps and includethem in a new MapList Rescale PHA Mapextractingnegativevalues DisplayHotspotsMapList Final HotspotfrequencyMap SumHotspotstogenerate a Final Map
Resample of Rio Cuarto DepartmentArea Apply a Masktoleaveonly NDVI Valuesinside Rio Cuarto Department NDVI =DN*0.004-0.10 NDVI Digital NumberMap of South America Rescaled NDVI Map of South America NDVI Mapinside Rio Cuarto Department NDVI Map of theStudyArea MapListincludingallthe PHA Maps PHA=8.974*NDVI-3.7481 PlanthopperAbundanceMap (PHA) Rescaled PHA Map DisplayMapList of PHA GenerateHotspotsMaps and includethem in a new MapList Rescale PHA Mapextractingnegativevalues DisplayHotspotsMapList Final HotspotfrequencyMap SumHotspotstogenerate a Final Map
Resample of Rio Cuarto DepartmentArea Apply a Masktoleaveonly NDVI Valuesinside Rio Cuarto Department NDVI =DN*0.004-0.10 NDVI Digital NumberMap of South America Rescaled NDVI Map of South America NDVI Mapinside Rio Cuarto Department NDVI Map of theStudyArea MapListincludingallthe PHA Maps PHA=8.974*NDVI-3.7481 PlanthopperAbundanceMap (PHA) Rescaled PHA Map DisplayMapList of PHA GenerateHotspotsMaps and includethem in a new MapList Rescale PHA Mapextractingnegativevalues DisplayHotspotsMapList Final HotspotfrequencyMap SumHotspotstogenerate a Final Map
Resample of Rio Cuarto DepartmentArea Apply a Masktoleaveonly NDVI Valuesinside Rio Cuarto Department NDVI =DN*0.004-0.10 NDVI Digital NumberMap of South America Rescaled NDVI Map of South America NDVI Mapinside Rio Cuarto Department NDVI Map of theStudyArea MapListincludingallthe PHA Maps PHA=8.974*NDVI-3.7481 PlanthopperAbundanceMap (PHA) Rescaled PHA Map DisplayMapList of PHA GenerateHotspotsMaps and includethem in a new MapList Rescale PHA Mapextractingnegativevalues DisplayHotspotsMapList Final HotspotfrequencyMap SumHotspotstogenerate a Final Map
Resample of Rio Cuarto DepartmentArea Apply a Masktoleaveonly NDVI Valuesinside Rio Cuarto Department NDVI =DN*0.004-0.10 NDVI Digital NumberMap of South America Rescaled NDVI Map of South America NDVI Mapinside Rio Cuarto Department NDVI Map of theStudyArea MapListincludingallthe PHA Maps PHA=8.974*NDVI-3.7481 PlanthopperAbundanceMap (PHA) Rescaled PHA Map DisplayMapList of PHA GenerateHotspotsMaps and includethem in a new MapList Rescale PHA Mapextractingnegativevalues DisplayHotspotsMapList Final HotspotfrequencyMap SumHotspotstogenerate a Final Map
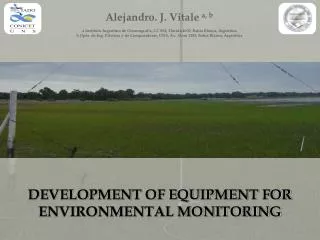
Development of a tool for dynamic monitoring of mosquito larval habitat availability in Córdoba – Argentina Raquel M. Gleiser
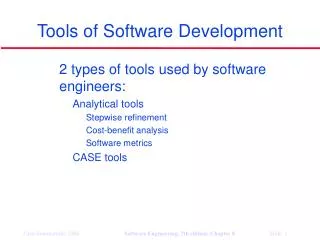
Mosquito Ecology • Drought resistant eggs are laid in the mud and hatch when flooded • Changes in flood surface are critical for eggs to hatch (and females to lay eggs) • Rain after dry periods: greener vegetation • Weekly changes in NDVI positively related to larvae in the field
SPOT V NDVI Makesubsetmap A of Mar Chiquita area, Cordoba, Argentina Create GeoReference for window area Import SPOT V NDVI imageto ILWISS format Subsetmap B MapCalc NDVI change between map A and map B Mask of floodproneareas Make NDVI change map in flood prone areas FloodareaChangemap2 Obtain statistics per changemap FloodareaChangemap3 … Create MapList FloodareaChangemap6 Rainfall data Create average NDVI change map: identify most likely mosquito habitat Graph of NDVI change and rainfall in flood prone areas
SPOT V NDVI Makesubsetmap A of Mar Chiquita area, Cordoba, Argentina Create GeoReference for window area Import SPOT V NDVI imageto ILWISS format Subsetmap B MapCalc NDVI change between map A and map B Mask of floodproneareas Make NDVI change map in flood prone areas Flood area Changemap2 Obtain statistics per changemap FloodareaChangemap3 … Create MapList Floodarea Changemap6 Rainfall data Create average NDVI change map: identify most likely mosquito habitat Graph of NDVI change and rainfall in floodproneareas
Import SPOT V NDVI image to ILWISS format Makesubsetmap A of Mar Chiquita area, Cordoba, Argentina Create GeoReference for window area Subsetmap B MapCalc NDVI change between map A and map B Mask of floodproneareas Make NDVI change map in flood prone areas Flood area Changemap2 Obtain statistics per changemap FloodareaChangemap3 … Create MapList Floodarea Changemap6 Rainfall data Create average NDVI change map: identify most likely mosquito habitat Graph of NDVI change and rainfall in floodproneareas
Import SPOT V NDVI image to ILWISS format Makesubsetmap A of Mar Chiquita area, Cordoba, Argentina Create GeoReference for window area Subsetmap B MapCalc NDVI change between map A and map B MapCalc NDVI change between map A and map B Mask of floodproneareas Make NDVI change map in flood prone areas Flood area Changemap2 Obtain statistics per changemap FloodareaChangemap3 … Create MapList Floodarea Changemap6 Rainfall data Create average NDVI change map: identify most likely mosquito habitat Graph of NDVI change and rainfall in floodproneareas
Import SPOT V NDVI image to ILWISS format Makesubsetmap A of Mar Chiquita area, Cordoba, Argentina Create GeoReference for window area Subsetmap B MapCalc NDVI change between map A and map B Mask of flood prone areas Make NDVI change map in flood prone areas Make NDVI change map in flood prone areas Flood area Changemap2 Obtain statistics per changemap FloodareaChangemap3 … Create MapList Floodarea Changemap6 Rainfall data Create average NDVI change map: identify most likely mosquito habitat Graph of NDVI change and rainfall in floodproneareas
Import SPOT V NDVI image to ILWISS format Makesubsetmap A of Mar Chiquita area, Cordoba, Argentina Create GeoReference for window area Subsetmap B MapCalc NDVI change between map A and map B Mask of flood prone areas Make NDVI change map in flood prone areas Flood area Changemap2 Obtain statistics per changemap Flood area Changemap3 … Create MapList Create MapList Flood area Changemap6 Rainfall data Create average NDVI change map: identify most likely mosquito habitat Create average NDVI change map: identify most likely mosquito habitat Graph of NDVI change and rainfall in floodproneareas
Import SPOT V NDVI image to ILWISS format Makesubsetmap A of Mar Chiquita area, Cordoba, Argentina Create GeoReference for window area Subsetmap B MapCalc NDVI change between map A and map B Mask of flood prone areas Make NDVI change map in flood prone areas Flood area Changemap2 Obtain statistics per changemap Flood area Changemap3 … Create MapList Create MapList Flood area Changemap6 Rainfall data Create average NDVI change map: identify most likely mosquito habitat Create average NDVI change map: identify most likely mosquito habitat Graph of NDVI change and rainfall in flood prone areas
THANK YOU!!! • We want to thank Ben and team for the help and opportunity to participate in this training event and the kind environment that you created!!!