Download
1 / 18
180 likes | 222 Views
Learn to measure dispersion, compute z-scores, find percentages using normal curve, and more to analyze vacation expenses statistically.

E N D
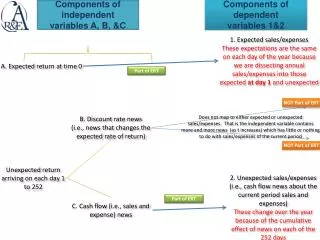
1-4Vacation Expenses OBJECTIVES Measure dispersion using standard deviation units. Compute z-scores. Find percentages using the normal curve. Compute raw scores using z-scores.
Key Terms raw data normal curve standard score z-score normal distribution bell curve asymptomatic tails
How can graphs help describe frequency distributions? What would help you organize data in a more visual format?
Example 1 A summer camp is taking their 220 sixth graders on a trip to an amusement park. For safety purposes, some of the rides have height requirements. The campers’ heights have a mean of 56 inches and a standard deviation of 3 inches. What is the z-score for a camper with a height of 62 inches?
Example 1 A summer camp is taking their 220 sixth graders on a trip to an amusement park. For safety purposes, some of the rides have height requirements. The campers’ heights have a mean of 56 inches and a standard deviation of 3 inches. What is the z-score for a camper with a height of 62 inches?
Example 2 The height of a certain student on this trip had a z-score of -0.5. What is the student’s height in inches?
Example 2 The height of a certain student on this trip had a z-score of -0.5. What is the student’s height in inches?
Example 2 The height of a certain student on this trip had a z-score of -0.5. What is the student’s height in inches?
Example 3 Recall the amusement park trip from Examples 1 and 2. A certain ride requires riders to be at least 51 inches tall. The heights are normally distributed with mean 56 and standard deviation 3. Approximately how many of the camp’s 220 sixth graders will not be allowed on the ride?
Example 3 Recall the amusement park trip from Examples 1 and 2. A certain ride requires riders to be at least 51 inches tall. The heights are normally distributed with mean 56 and standard deviation 3. Approximately how many of the camp’s 220 sixth graders will not be allowed on the ride?
Example 3 Recall the amusement park trip from Examples 1 and 2. A certain ride requires riders to be at least 51 inches tall. The heights are normally distributed with mean 56 and standard deviation 3. Approximately how many of the camp’s 220 sixth graders will not be allowed on the ride?
Example 4 The families of students at Smithtown High School were surveyed about their vacation expenses. The results were normally distributed with mean $2,313 and standard deviation $390. What percent of the families took vacations that cost between $2,000 and $3,000?
Example 4 The families of students at Smithtown High School were surveyed about their vacation expenses. The results were normally distributed with mean $2,313 and standard deviation $390. What percent of the families took vacations that cost between $2,000 and $3,000?
Example 4 The families of students at Smithtown High School were surveyed about their vacation expenses. The results were normally distributed with mean $2,313 and standard deviation $390. What percent of the families took vacations that cost between $2,000 and $3,000?
Example 4 The families of students at Smithtown High School were surveyed about their vacation expenses. The results were normally distributed with mean $2,313 and standard deviation $390. What percent of the families took vacations that cost between $2,000 and $3,000?
Example 5 A local travel magazine rates hotels using integers from 0 to 100. Last year they rated over 2,000 hotels. The ratings were normally distributed with mean 78 and standard deviation 6.5. How high would a hotel’s rating have to be for it to be considered in the top 10% of rated hotels?
Example 5 invNorm(.90,0,1) 1.28 A local travel magazine rates hotels using integers from 0 to 100. Last year they rated over 2,000 hotels. The ratings were normally distributed with mean 78 and standard deviation 6.5. How high would a hotel’s rating have to be for it to be considered in the top 10% of rated hotels?
Example 5 invNorm(.90,0,1) 1.28 A local travel magazine rates hotels using integers from 0 to 100. Last year they rated over 2,000 hotels. The ratings were normally distributed with mean 78 and standard deviation 6.5. How high would a hotel’s rating have to be for it to be considered in the top 10% of rated hotels?