Download
1 / 20
220 likes | 462 Views
Human Cell Line. Quality Control Through. STR Analysis At ATCC. Greg Sykes, Robyn Hedges, Ming Hui, and Yvonne Reid. STR Analysis: From Cells To Data. Cultured Cells. Import Into In-House Database for Comparison (Paradox macro). DNA Extraction (MoBio UltraClean DNA

E N D
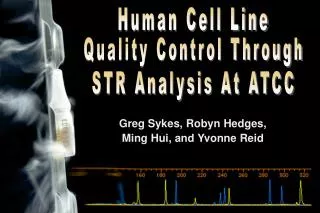
Human Cell Line Quality Control Through STR Analysis At ATCC Greg Sykes, Robyn Hedges, Ming Hui, and Yvonne Reid
STR Analysis: From Cells To Data Cultured Cells Import Into In-House Database for Comparison(Paradox macro) DNA Extraction (MoBio UltraClean DNA Bloodspin Kit, FTA Paper) GeneScan 3.1 and Genotyper 2.0 Analysis (peak detection and labeling) PowerPlex 1.2 PCR (Promega) Electrophoretic Fractionation and Fragment Detection (ABI 310)
Table 1. The Promega PowerPlex 1.2 STR Loci STR LocusChromosomal Location5’3’ Repeat Amelogenin Xp22.10-22.3 and Y n/a CSF1PO 5q33.3-34 AGAT D5S818 5q21-q31 AGAT D7S820 7q AGAT D13S317 13q22-q31 AGAT D16S539 16q24-qter AGAT TH01 11p15.5 AATG TPOX 2p23-pter AATG vWA 12p12-pter AGAT Probability of a random match is lower than 1 in 108.ATCC holds over 2,000 human cell lines.
Cell Line Workflow and How It Relates To the STR Analysis Depositor Material/ Token Freeze • Profile Baseline • Designated as oldest, most • original material • Cross-compared against all • existing profiles at ATCC Master Cell Bank (Seed Freeze) • Comparison Profiles • Cross-compared against all • profiles of that cell line Working Cell Bank (Distribution Freeze)
Unlike STR profiles generated from normal human material, valid data from tumor cell lines are more complex due to: • Heterogeneous original population (differences between cancer cells within the same mass) and subsequent selection. • Addition or loss of chromosomal material due to uneven karyokinesis and cell hybrids. • Mutation events occurring within the DNA sequence. • Genetic drift with subsequent culture expansions.
Figure 1. Example of a standard karyotype from CCL-75 (WI 38), normal lung tissue (n=46)
Figure 2. Example of a karyotype from CRL-2061 (SJRH30), a rhabdomyosarcoma cell line (n=84)
Figure 3. This relatively balanced-peak electropharogram of a colon adenocarcinoma cell line is atypical of cell line profiles.
Figure 4. Most tumor and transformed cell line profiles have unbalanced peaks, but the data are reproducible. This example happens to be from a liver adenocarcinoma.
Figure 5. This sample was submitted to the ATCC as a cancer line coming from a single patient. With six loci having trisomies or more, this line is considered cross contaminated.
The amelogenin locus is useful in cell culture profiles: • Finding appropriate X or X, Y peaks confirms the gender of the cell line (when provided). • Female-derived cell lines with X, Y profiles are investigated; if the Y cannot be explained, the line is failed (not accessioned).
Results From Chromosome Rearrangement Y Chromosome Figure 6. Based upon classic cytogenetic testing, cell line HTB-144 (JAR) was labeled “female.” STR analysis detected “Y” amelogenin. FISH analysis confirmed translocated Y chromosome material.
Cell lines submitted as male but lack Y amelogenin are documented and approved because: • A deletion on the Y chromosome amelogenin primer binding site may prevent a strong (or any) signal. • Certain cancers (ex. bladder, renal, prostate, stomach, some leukemias) are more prone to a loss of the Y chromosome. • Y chromosome is absent in up to 85% of the bone marrow cells of normal elderly males.
Parental Figure 7. Profile differences may emerge between normal tissue and tumors from the same patient or between a parental and derived cell lines. These differences may include: • Nothing • Loss of heterozygosity (including locus drop-outs) • Gain of heterozygosity (somatic mutations)
Parental: scrape Derived: trypsin Figure 7. Profile differences may emerge between normal tissue and tumors from the same patient or between a parental and derived cell lines. These differences may include: • Nothing • Loss of heterozygosity (including locus drop-outs) • Gain of heterozygosity (somatic mutations)
Parental Derived Figure 8. Compared to the parental cell line CRL-2570 (A3), a microvariant emerges in a derived line, CRL-2571 (I 9.2), following exposure to the frame-shifting mutagen, ICR-191.
Unstable Alleles A EMASTER I P13 P15 P8 B F J P13 P13 P14 C G K P13 P13 P11 D H L P14 P11 P13 Figure 9. Cell lines rarely exhibit allelic instability. This umbilical cord line, CRL-1730 (HUV-EC-C), is an exception. Allele 9 at D13S317 has different intensities throughout the individual lots. However, the intensity of allele 9 within each lot is reproducible (ex. lot A = weak 9; lot B = strong 9; lot D = absent 9). Pn is the passage number.
Post-Electropherogram Interpretation and Data Analysis • Computer analysis cross-compares new baseline data with all previously generated profiles. • Working stock profiles are imported and checked against all earlier profiles of that cell line. • Cell lines with at least two independent analyses are posted on the ATCC website (http://www.atcc.org/Products/str.cfm). • Commercially available kits enable research institutions, collections, patent offices, and scientists to confidently confirm or dispute cell line purity and authenticity.
Summary • Prior to their accession and distribution, ATCC uses STR analysis to screen all human cell lines for authenticity and purity. • Tumor cell lines are unlike healthy tissue living within an organism. Most cell lines have undergone genetic mutation events. Abnormal karyology and sequence mutations impact the STR profile. • Tumor and transformed cell line data interpretation is more challenging than that from normal material, but the data are reproducible. • Resulting STR data can be globally communicated to researchers.
Acknowledgements Robyn Hedges Ming Hui Yvonne Reid tech@atcc.org Ed Cedrone Scott Durkin Brett Hankins Qassim Azizi Kristen Mundy Ruth Monk The most exciting phrase to hear in science, the one that heralds new discoveries, is not "Eureka!" (I found it!) but "That's funny." —Isaac Asimov