Chapter 4: Manufacturing Processes
Chapter 4: Manufacturing Processes. Learning Objectives. How production processes are organized Trade-offs to be considered when designing a production process The product-process matrix Break-even analysis Designing stations for an assembly line. Organization of Production Processes.

Chapter 4: Manufacturing Processes
E N D
Presentation Transcript
Learning Objectives • How production processes are organized • Trade-offs to be considered when designing a production process • The product-process matrix • Break-even analysis • Designing stations for an assembly line
Organization of Production Processes • Project • Workcenter • Manufacturing Cell • Assembly Line • Continuous Process
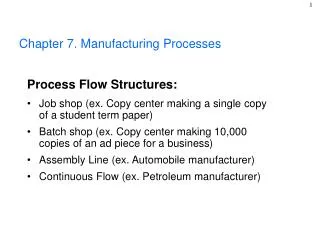
Product-Process Matrix: Framework Describing Layout Strategies Low - one-of-a-kind Project Workcenter Product Standardization Manufacturing Cell Assembly Line Continuous Process High - standardized commodity product Low Product Volume High
Break-Even Analysis • A standard approach to choosing among alternative processes or equipment • Model seeks to determine the point in units produced (and sold) where we will start making profit on the process or equipment • Model seeks to determine the point in units produced (and sold) where total revenue and total cost are equal • For machine alternatives A and B, at what volumes should we use machine A and at what volumes, machine B?
Break-Even Analysis (Continued) Break-even Demand= This formula can be used to find any of its components algebraically if the other parameters are known Purchase cost of process or equipment Price per unit - Cost per unit or Total fixed costs of process or equipment Unit price to customer - Variable costs per unit In formula terms: BEP(x) = F/[P-V]
Break-Even Analysis • Example: Suppose you want to purchase a new computer that will cost $5,000. It will be used to process written orders from customers who will pay $25 each for the service. The cost of labor, electricity and the form used to place the order is $5 per customer. How many customers will we need to serve to permit the total revenue to break-even with our costs? • Break-even Demand: = Total fixed costs of process or equip. Unit price to customer – Variable costs =5,000/(25-5) =250 customers
Break-Even Analysis (example) • Sale Price = $300 • Option 1: • Purchase from vendor= $200 * Demand • Option 2: • Low cost/volume machine (A) = $80,000 + $75 * Demand • Option 3: • High cost/volume machine (B) = $200,000 + $15 * Demand Purchase vs. A? A vs. B?
Calculations Purchase versus A: $200 * Demand = $80,000 + $75 * Demand ($200 * Demand) - ($75 * Demand) = $80,000 $125 * Demand = $80,000 Demand = $80,000/$125 = 640 units so – less than 640 units, purchase; 640 of greater, use Machine A Machine A versus Machine B: $80,000 + $75 *Demand = $200,000 + $15 * Demand Demand = $120,000/$60 = 2,000 units so – less that 2000 units use Machine A; 2000 or more use Machine B
Break Even Analysis Example • You are starting a new business and your fixed costs are estimated to be $500,000. Your product sells for $100 and costs you $50 to manufacture. What is the breakeven point? If you sell 15,000 units, what will be your profit? • Answer: Break Even Value is 10,000 and Profit is $250,000
Break Even Analysis Formulas • Total Revenue = Total Cost • P x = F + V x implies: • BEP(x) = F/[P-V] • Profit = TR-TC = (P-V) x – F • Breakeven between two machines: • F1 + V1 x and F2 + V2 x --assume F2 > F1 & V2 < V1 • BEP(x) = (F2 – F1) / (V1 – V2) Note: F = Fixed Cost; P = Price; V = Variable Cost
Break-even Problem Nicole is considering starting a business to manufacture greeting cards and is investigating two alternatives. Alternative 1 involves purchasing a computer and printing system for $10,000. The system can produce a card for 0.50 a card. Alternative 2 is to use a vendor who will make the cards for her and charge her $0.90 per card. If she plans to sell each card for $2.50, answer the following questions. • What is the break-even point for buying the system – i.e. when will she begin making a profit assuming she can sell the cards at $2.50 a piece. • Suppose Nicole feels she can sell 10,000 cards a year (assume for your calculations that she only is in business for one year). Should she make the cards herself or use the vendor? Calculate the profit for each option and compare. How much would she save following your advice? Calculate the breakeven point between buying the cards from the vendor and using the machine. Are your answers consistent?
Assembly Line Balancing • Specify the sequential relationships among tasks • Determine the required workstation cycle time • Cycle time C = Time available per day / Desired Output per day • Determine the theoretical minimum number of workstations • Theoretical minimum = Sum of all workstation task times / Cycle time C • Assign tasks, one a time, until the sum of the tasks is equal to the workstation cycle time • Use most successor rule or use longest time rule • Evaluate the efficiency of the balance • Efficiency = Sum of task times / # Workstations * Cycle time C • Rebalance if needed
Example 4.2 in the text – The Model J Wagon • The model J wagon is to be assembled on a conveyor belt. Five hundred wagons are required per day. Production time per day is 420 minutes, and the assembly steps and times for the wagon are as below, as are the precedence relationships. Find the balance that minimizes the number of workstations, subject to cycle time and precedence constraints.
Precedence Graph for Model J Wagon How should we allocate steps to stations? Cycle time = Daily Prod time available / Daily required output Min stations = Sum of task times / cycle time Allocation method: Use # successors and task times
Model J Wagon Problem: Allocating Steps to Stations • Cycle time = Daily Prod time available / Daily required output • 420* 60 sec /500 = 50.4 sec/unit • Min stations = Sum of task times / cycle time • 195 sec / 50.4 sec = 3.87 approx = 4 stations • Allocation method: Use # successors and task times