Download
1 / 81
810 likes | 835 Views
This lecture discusses the tools and methods used to compare the observed distribution of galaxies with the predictions made by models in the study of large scale structures and flows in cosmology. Topics covered include correlation functions, topology, power spectrum, count statistics, void probability function, genus, GS wavelets, fractals, filling factor, and more.

E N D
AY202a Galaxies & DynamicsLecture 20:Large Scale Structure & Large Scale Flows
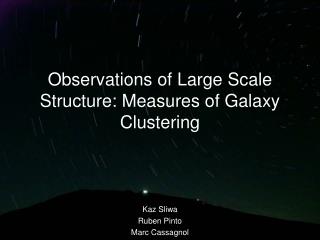
Cosmology from LSS Compare the observed distribution of galaxies with those predicted by models: Tools: Correlation functions Topology Power Spectrum Count Statistics (counts-in-cells, …) Void Probability Function Genus GS Wavelets Fractals Filling Factor etc.
Correlation Functions Angular correlation function ω(θ) is defined by δPθ = N [1 + ω(θ)] δΩ where N is the number of objects per steradian and δPθ is the probability of finding an object with solid angle δΩ at an angular distance θ from a randomly chosen object. (draw rings around each galaxy and count its neighbors as a function of angular radius)
The Spatial Correlation Function ξ(r) or ξ(s) is defined by δPr = n [1 + ξ(r)] δV where n is the volume number density of objects and δPr is the probability of finding an object within volume element δV at a distance r from a randomly chosen object. Peebles (and everyone since) found roughly ξ(r) ~ B r-γ = (r/r0) -γ and observationallyγ ~ 1.8
Correlation Function Estimation <DD> <RR> Hamilton ξ = or = <DD>/<DR> Landy & Szalay ξ = (<DD> - 2<DR> + <RR>)/<RR> <DR>2
Separation measures How do we measure scales and separations in 3D? Simplest way is just projected r = tan(θ) D = tan(θ) (v1+v2)/2H0 But should velocity separation be included? If so define the separation s = (v12 + v22 – 2v1v2 cos θ)½ /H0 which works well outside clusters (a little messy with F.o.G.)
Not all galaxies are created equal… What is the proper way to weight the galaxies in the CF estimators? Simple is Unit weight w(r) = 1 for each galaxy But, if one only counts pairs, you will weight galaxies in clusters more than those outside. So use minimum variance weighting (Davis et al) w(r,x) = [1 + 4 n(r) J3(x)]-1 where J3(x) = ξ(y) y2 dy = volume integral of the CF x 0
R0=6.8 h-1 Mpc a = -1.2 for K < -22 M. Westover M. Westover
(r1,r2)2 dr1 dr Ψ1Ψ2ξ(r12/r0) [ r2 dr Ψ ]2 Angular and Spatial Correlation functions are related by Limber’s Equation ω(θ) = for a homogeneous model [Limber ApJ 117, 134 (1953)]
Velocity Space Correlations 1960’s + 1970’s Layzer & Irvine, Geller & Peebles made the connection between random galaxy motions and gravitational clustering a.k.a. The Cosmic Virial Theorem <v2(r)> ~ G <ρ> ξ(r) r2 Roughly, the field velocity dispersion is related to the mean mass density through the spatial correlation function
Pairwise Velocity Dispersion Calculate the bivariate CF ξ (rp,) is the l.o.s. separation of a pair in Mpc = |(v1 – v2)| /H0 rp is the projected separation, also in Mpc = tan θ(v1 + v2) /2H0
ξ(rp,) no clusters
One of many connundrums in the 1990’s --- the data indicated a low
2dF σ vs results
Clusters Cluster, Too Bahcall& Soniera, ‘83 Klypin & Kopylov ‘83 PGH 86, etc. r0 ~ 15-25 h-1 Mpc depending on richness
Counts in Cells Analysis nocc = # of galaxies per occupied cell nexp = expected # per cell Filaments Data Sheets & Intersecting Sheets Filaments versus Surfaces deLapparent, Geller & Huchra
The Power Spectrum Suppose the Universe is periodic on a volume VU. Consider the Simplest case, a volume limited sample with equal weight galaxies, N galaxies. Measure fluctuations on different scales in volume V: P(k) = (<|δk|2> - 1/N) (Σ |wk|2)-1 (1-|wk|2)-1 where δk = 1/N Σe ik.xj - wk And w(x) is the window function for the survey = 1 inside and = 0 outside the boundaries k j
So w(x) = V/VUΣ wk e-ik.x wk is the Fourier Transform of w(x) This derives from <|δk|2> = δk0D + 1/N + P(k) variance sample Poisson Fluctuations Real Power mean due to finite sampling per mode (see Peacock & Dodds; Park et al 1994) Kronecker delta
SDSS Tegmark et al. 2004
SDSS vs and plus other measures Red line are from a Monte Carlo Markov chain analysis of the WMAP for simple flat scalar adiabatic models parameterized by the densities of dark energy, dark matter, and baryronic matter, the spectral index and amplitude, and the reionization optical depth.
2dF PS constraints on
Simulations Industry started by S. Aarseth followed by Efstathiou, White, Frenk & Davis and now many others. (c.f. Virgo Consortium) Big groups at MPI, NCSA, Chicago. N-Body codes or N-body Hydro codes (PP, PPM, Grid, SPH)
=1 α = 3.2 = 1 α = 1.8 = 1 α = 0.0 =0.09 α = 2.4 = 0.2 α = 1.8 = 1 α = 4.5 DEFW ‘85
LCDMsimulationFilaments are warm Hydrogen(~10^5 K)250 Mpc CubeHernquist 2003
SCDM VIRGO Consortium
By the middle 1990’s it was clear- at least to the observers – that SCDM was dead.
Baryon Acoustic Oscillations Eisenstein et al ’05 noted that LRG sample had large effective volume
Simulations from D. Eisenstein based on Seljak & Zaldarriaga (CMBfast code) Evolution of Fluctuations of different Stuff
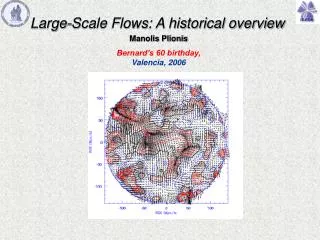
Large Scale Motions Rubin 1952 Distortions deVaucouleurs 1956 Local Supergalaxy Supercluster Rubin, Ford, Thonnard, Roberts 1976 + answering papers Peebles – Silk – Gunn early ’70’s Mass and Light CMB dipole 1976-79 Wilkinson++, Melchiori++ (balloons) Virgo Infall Schechter ’80, TD ’80, DH ’82, AHMST ’82 Great Attractor --- 1985 Seven Samurai (BFDDL-BTW) Kaiser 1985 Caustics IRAS Surveys 1985 Davis, Strauss, Fisher, H, ++ ORS 1992 Santiago et al.