Download
1 / 12
120 likes | 280 Views
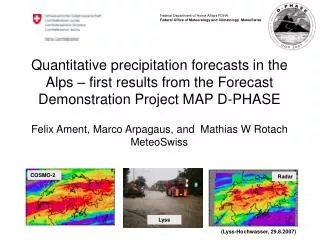
Quantitative precipitation forecasts in the Alps – first results from the Forecast Demonstration Project MAP D-PHASE. Felix Ament, Marco Arpagaus, and Mathias W Rotach MeteoSwiss. COSMO-2. Radar. Lyss. (Lyss-Hochwasser, 29.8.2007). Verification – rules of the game. Models.

E N D
Quantitative precipitation forecasts in the Alps – first results from the Forecast Demonstration Project MAP D-PHASE Felix Ament, Marco Arpagaus, and Mathias W RotachMeteoSwiss COSMO-2 Radar Lyss (Lyss-Hochwasser, 29.8.2007)
Verification – rules of the game Models apply warnlevels domain averages Most recent forecast, but starting not before +03h hourly accumulations Alert time series RR time series OBS • Period: Summer 2007 (June, July and August) • Spatial resolution: 18 target regions in Switzerland • Temporal resolution: 3 hour intervals • Forecast range: Use most recent forecast, but ignore a certain cut-off time at the beginning of each forecast (default cut-off: 3h)
Observational data RADARtime series Swiss Radar composite • Warn regions averages • Hourly accumulations • 3 Radar stations • 5 min scans accumulated to hourly estimates • 1km resolution • Spatial average • Multiplicative correction to achieve match of daily accumulations RADAR_CALtime series Gridded raingauge data • Spatial average • Warn regions averages • Hourly accumulations • Daily sums equivalent to gridded gauge data • Statistical interpolation + elevation correction • Daily accumulations
Verification of precipitation amount(RADAR_CAL reference) resolved conv. global model param. conv. RADAR Whole Switzerland,summer 2007,relative BIAS Single target region,summer 2007,relative BIAS Single target region,3 hourly resolution,correlation
Fuzzy Verification Verification on coarser scales than model scale: “Do not require a point wise match!“
good bad Fuzzy Verification COSMO-2 – COSMO-7 JJA 2007, Verification against Swiss Radar Composite, 3 hourly accumulations - 90 58 33 20 7 = Upscaling Spatial scale (km) Difference COSMO-2 (2.2km) COSMO-7 (7km) - 90 58 33 20 7 = Fraction skill score Spatial scale (km) Threshold (mm/3h) Threshold (mm/3h) Threshold (mm/3h) COSMO-7 better COSMO-2 better
good bad Fuzzy Verification COSMO-DE – COSMO-EU JJA 2007, Verification against Swiss Radar Composite, 3 hourly accumulations - 90 58 33 20 7 = Upscaling Spatial scale (km) Difference COSMO-DE (2.8km) COSMO-EU (7km) - 90 58 33 20 7 = Fraction skill score Spatial scale (km) Threshold (mm/3h) Threshold (mm/3h) Threshold (mm/3h) COSMO-EU better COSMO-DE better
Alerts – level „yellow“, 3h intervals (Alert level yellow = return frequency of 6 times per year) and but
Concept of “Relative Value” Economic point of view: Event Precautions causes Costs Having no protection results in Losses Precaution Relative Value - 0.0 useless 0.25 Total Cost 0.5 0.75 + useful 1.0 noforecast realforecast perfectforecast
Relative value – Alert level „yellow“ (03h, 06h and 12h accumulations, cut-off +03h) all models param. conv. + useful resolved conv. RADAR global model - useless insensitive … sensitive … … against false alarms
Calibration versus Ensemble D-PHASE poor- men's ensemble Issue an alert, if a certain fraction of all models gives a warning Simple calibration of COSMO-2 Multiply COSMO-2 precipitation forecasts by a factor of 10% 20% 30% 40% 50% 60% 70% 80% 90% 2.0 1.25 1.0 0.8 0.5 COSMO-2
Conclusions • Observational uncertainties (QPE) are not significantly smaller than forecast errors (QPF) – at least for extremes! • High resolution models resolving deep convection tend to perform better than models with parameterized convection. This applies for all international models. • Probabilistic forecasts are useful for customers. However, the method of choice is still unclear: Simple static recalibration and an uncalibrated ensemble forecasting system perform equally!