Download
1 / 17
170 likes | 296 Views
Converting Depth-Cost Output from the Corps GL-SAND model to SVM Input. Outline. Goal of the work Why GL-SAND is not used directly Specific Steps in the Translation Checking to make sure the SVM and the GL-SAND estimate costs identically. The concept of navigation benefits.

E N D
Converting Depth-Cost Output from the Corps GL-SAND model to SVM Input
Outline • Goal of the work • Why GL-SAND is not used directly • Specific Steps in the Translation • Checking to make sure the SVM and the GL-SAND estimate costs identically
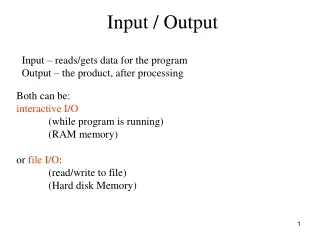
The concept of navigation benefits • Like Hydropower, the intent is to measure net changes in public welfare, not profit • In this case, the metric is the cost of shipping the same quantity of goods • When water levels are higher, ships can be loaded to greater depths, so it takes fewer trips to carry the same cargo
The SVM Inputs • Buffalo district Corps of Engineers uses a model (GL-Sand) to calculate how much shipping costs would be reduced if harbors were dredged more deeply • They applied that model, normally used for the Corps maintenance dredging program, to shipments throughout the Great Lakes • The model produces depth-cost functions by shipment category • The data must be pre-processed so that depths can be related to water surface elevations depth-cost water surface elevations.
The GL-SAND output • The GL-SAND produces comma separated values for costs for each calendar month for depths varying from 168” to 408” • There are two output file sets • shipments within the U.S. or between U.S. and Canada • Shipments within Canada or between a Great Lakes port and an overseas port • Note: Because Lake Ontario and St. Lawrence Seaway levels are not modeled in the SVM, trip costs with one port below Erie (Ontario, St. Lawrence River, all foreign ports) are based on depths to Lake Erie. It is assumed that the amount of water available at the Ontario, St. Lawrence or foreign port is more than the depth available on the Upper Great Lakes. While this won’t always be true, assuming it’s true should give a true picture of the change in costs between plans and scenarios since all plans and scenarios will have the same error. • Versions of the SVM up to November 2010 truncated voyages this way but also made the mistake of using the Ontario or St. Lawrence port depths as Erie port depths, which may have made the Erie depth the controlling depth in some cases. This is surely a small error in calculating net benefits because Erie depths are nearly identical for all plans and because shipments below Erie are only a portion of the shipments below Lake St. Clair, but it is corrected in 2011 SVMs.
The GL-SAND output • To eliminate the “false” port and also address the fact that we can’t model water surface elevations in foreign ports, the dock depths at Lake Ontario or the St. Lawrence, voyages with a foreign, Lake Ontario or St. Lawrence port will be re-defined as 999 inches so that they never drive costs.
The SVM Inputs • The SVM calculates the depth at each dock and all the connecting channels in between each month • The ship in this movie jumps to the shallowest reach on this journey each month, showing that you have to check each segment for depth each month. (Two ships means it’s a tie).
The SVM Calculation Simulated monthly water surface elevations are converted to gage readings for each lake by subtracting low water datum. Row 24 is the first month, 25 the next, etc. These are later used to calculate DEPTHS at the origin and destination docks.
The SVM Calculation Based on known project depths for the connecting channels, the connecting channel depths are calculated from the gage readings. Detroit and St Clair gages are calculated as the averages of the lakes above and below them, while the three St. Marys levels are based on 2 river gage calculations and MH levels (Rock Cut).
The SVM Calculation The first sub-route in column Q includes trips between Lake Superior (5) and Lake Superior (5) (all sub-routes that start and end on Superior are in Route 1) with docks depths of 300 and 324 inches. The pre-SVM processing reduced 3,100 routes (trips between one specific dock to another specific dock) to 240 sub-routes (a sub-route combines all trips between two lakes so long as the docks on lake 1 are all at the same depth and the docks on lake 2 are all on the same depth).
The SVM Calculation Each sub-route may or may not have shipments in a particular month. These 12 numbers are used to look for the right depth-cost curve on the CN Costs worksheet CN Costs Each row in CN Costs is a depth-cost function for one sub-route in one calendar month. For example on this sub-route coded for route 1, lake 5 to lake 5, dock depths 324” and 336” below LWD, the costs for shipping when the least depth on the trip is 408”is $228,360. That may be the sum of the 408” costs for several different voyages, even ships and cargoes.
The SVM Calculation An even 200, 400, etc. means no trips that month. Notice that the May value is 801 and June is 1002 and down below there are costs for month 5 and 6. The equation for May on this sub-route is =OFFSET('CN Costs'!$C$2,INDIRECT(CONCATENATE(Q$1,$O28+10)),409-MIN(MIN(INDIRECT(CONCATENATE(Q$7,ROW(),":",Q$8,ROW())),INDIRECT(CONCATENATE(Q$5,ROW()))+Q$9,INDIRECT(CONCATENATE(Q$6,ROW()))+Q$10)))
May year 1 costs for sub-route 155,300,324 Offset starting from cell C2 on CN Costs – C2 is the one that says “January costs” OFFSET('CN Costs'!$C$2,INDIRECT(CONCATENATE(Q$1,$O28+10)),409-MIN(MIN(INDIRECT(CONCATENATE(Q$7,ROW(),":",Q$8,ROW())),INDIRECT(CONCATENATE(Q$5,ROW()))+Q$9,INDIRECT(CONCATENATE(Q$6,ROW()))+Q$10))) Let’s break the whole equation down . . .
May year 1 costs for sub-route 155,300,324 Q$7=H OFFSET('CN Costs'!$C$2,INDIRECT(CONCATENATE(Q$1,$O28+10)), 409-MIN(MIN(INDIRECT(CONCATENATE(Q$7,ROW(), ":",Q$8,ROW())),INDIRECT(CONCATENATE(Q$5,ROW()))+Q$9, INDIRECT(CONCATENATE(Q$6,ROW()))+Q$10))) Q$8=H Q$5=D Q$6=D That means OFFSET from cell C2 on CN Costs 801 rows (the value in cell Q$1 js the letter “Q” and $O28 = 5 for May Q(5+10) = Q15 = 801 rows; this gives you the right sub-route And then offset 105 columns (this is the complicated part, because it solves for the minimum depth and then figures out how many columns it has to count over to get it). 409 is one more than the deepest depth on the depth-cost table. So the column count is 409 minus the minimum of: Minimum (H28:H28) = connecting channel depth = 9999 D28 (the Superior gage=4) + Q$9 (the East dock depth=300) = 304 D28 (again Superior gage = 4) + Q$10 (the West dock depth = 324) = 328 409-304 = 105 columns to the right
May year 1 costs for sub-route 155,300,324 OFFSET from C2 801 rows 105 columns
What wasn’t covered in this documentation? • The process of converting the GL-SAND model outputs • Analysis in the SVM that points to which sub-routes are driving costs. Some ships ALWAYS have enough depth. Some ships often have depth problems but they can’t be helped by Superior regulation. And then there must be some that are key, and those might illuminate our plan formulation efforts because we’d know when and where we need more or less water. • To be continued.
Analysis • The locations of the minimum depth for ships passing through the Soo shows where the critical water supply issue is and may help provide a clue for improving the regulation plan to create more navigation benefits. • This work has just begun.