Download
1 / 17
170 likes | 313 Views
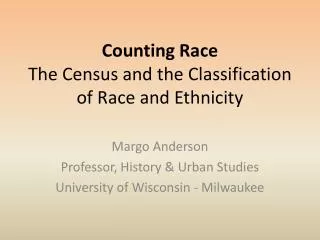
Census Disability Rates among Older People by Race/Ethnicity and Type of Hispanic Origin. Kyriakos S. Markides Karl Eschbach Laura A. Ray M. Kristen Peek. Hypotheses.

E N D
Census Disability Rates among Older People by Race/Ethnicity and Type of Hispanic Origin Kyriakos S. Markides Karl Eschbach Laura A. Ray M. Kristen Peek
Hypotheses • Older Hispanics as a group will have greater disability rates than older Non-Hispanic Whites, rates that are only slightly lower than those for African Americans. • Older Asian and Pacific Islanders will have disability rates that are somewhat lower than those of older Non-Hispanic Whites. • Older Native Americans (American Indians and Alaska Natives) will have high disability rates possibly higher than any other population.
Hypotheses (continued) • Among the Hispanic populations, older Puerto Ricans will have the highest disability rates with older Cubans having the lowest and Mexican Americans having intermediate rates. • It is not clear what rates for older Central Americans and older South Americans would be like given absence of guidance from existing literature. We might hypothesize that since these groups are overwhelmingly immigrants, that their rates might be somewhat lower than rates for Mexican Americans if indeed they are selected through migration. Given that men are more likely to be selected than women, men will have lower disability rates.
Hypotheses (continued) • It is also not clear what the rates for Other Hispanics might be like. Other Hispanics are a heterogeneous mix of Spaniards, Dominicans, perhaps some Filipinos, as well as more than a few Mexican Americans, Puerto Ricans, and Cubans and persons of mixed ancestry who fail to identify with a specific Hispanic origin in their responses to the Census. Given this mix, we might expect them to exhibit average disability rates perhaps similar to those for Mexican Americans. • Among older persons of Mexican origin the foreign-born will have lower disability rates than the native-born. This is more likely to be the case for men than for women.
Note: Directly standardized to age 65+ population, U.S. all racial/ethnic groups in 2000, for ages 65-69, 70-74, 75-79, 80-84, 85-89, 90+.
Table 1 Age-standardized census disability rates (percent) by race/ethnicity for persons 65 over: United States Census, 2000 Note: Directly standardized to age 65+ population, U.S. all racial/ethnic groups in 2000, for ages 65-69, 70-74, 75-79, 80-84, 85-89, 90+.
Note: Directly standardized to age 65+ population, U.S. all racial/ethnic groups in 2000, for ages 65-69, 70-74, 75-79, 80-84, 85-89, 90+. Note: Hispanic origin persons are recorded based on ancestry or country of birth, if they report general Hispanic. “All Other” includes U.S. born Hispanics, who report non-specific identity, and who live in a Southwestern state.
Table 2. Age-standardized census disability rates (percent) for persons 65 and over by type of Hispanic origin: United States Census, 2000
Note: Directly standardized to age 65+ population, U.S. all racial/ethnic groups in 2000, for ages 65-69, 70-74, 75-79, 80-84, 85-89, 90+.
Table 3. Age-standardized census disability rates (percent) for U.S. born and foreign born men 65 and over by race/ethnicity: United States Census, 2000 Note: Directly standardized to age 65+ population, U.S. all racial/ethnic groups in 2000, for ages 65-69, 70-74, 75-79, 80-84, 85-89, 90+.
Note: Directly standardized to age 65+ population, U.S. all racial/ethnic groups in 2000, for ages 65-69, 70-74, 75-79, 80-84, 85-89, 90+.
Table 4. Age-standardized census disability rates (percent) for U.S. born and foreign- born females 65 and over by race/ethnicity: United States Census, 2000 Note: Directly standardized to age 65+ population, U.S. all racial/ethnic groups in 2000, for ages 65-69, 70-74, 75-79, 80-84, 85-89, 90+.
Note: Hispanic origin persons are recoded to a specific group based on ancestry or country of birth, if they report general Hispanic. Note: Directly standardized to age 65+ population, U.S. all racial/ethnic groups in 2000, for ages 65-69, 70-74, 75-79, 80-84, 85-89, 90+.
Table 5. Age-standardized census disability rates (percent) for U.S. born and foreign-born males 65 and over by type of Hispanic origin: United States Census, 2000. Note: Hispanic origin persons are recoded to a specific group based on ancestry or country of birth, if they report general Hispanic. Note: Directly standardized to age 65+ population, U.S. all racial/ethnic groups in 2000, for ages 65-69, 70-74, 75-79, 80-84, 85-89, 90+.
Note: Hispanic origin persons are recoded to a specific group based on ancestry or country of birth, if they report general Hispanic. Note: Directly standardized to age 65+ population, U.S. all racial/ethnic groups in 2000, for ages 65-69, 70-74, 75-79, 80-84, 85-89, 90+.
Table 6. Age-standardized census disability rates (percent) for U.S. born and foreign-born females 65 and over by type of Hispanic origin: United States Census, 2000. Note: Hispanic origin persons are recoded to a specific group based on ancestry or country of birth, if they report general Hispanic. Note: Directly standardized to age 65+ population, U.S. all racial/ethnic groups in 2000, for ages 65-69, 70-74, 75-79, 80-84, 85-89, 90+.
Appendix Table. Unweighted frequency counts for race and Hispanic origin subjects 65 years-old or older in the Census 2000 5 percent public-use micro data file, by gender and immigrant status * For Puerto Ricans, “immigrant” refers to persons born in Puerto Rico or abroad.