Download
1 / 13
130 likes | 157 Views
This article explores the importance of ownership of handheld devices in education, highlighting research findings on the impact of ownership on students' engagement, achievement, and learning environments. It also discusses the role of quality and quantity of use in handheld device usage.

E N D
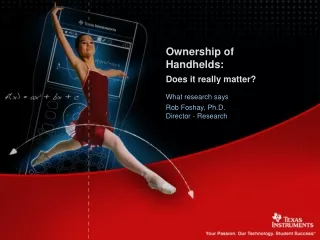
Ownership of Handhelds: Does it really matter? What research says Rob Foshay, Ph.D. Director - Research
Making Technology Personal • More than half of all high school students want mobile devices to help them learn • Only 15 percent of school leaders support this Source: Project Tomorrow. Credit: David Julian • -- Project Tomorrow • www.tomorrow.org
Why Could Ownership Matter? Personal handhelds may promote: • Engagement with math • Higher achievement • “Cool factor” • Home and classroom learning environment
Which counts the most in handheld usage? Quality of use Quantity of Use or
Quantity of Use Counts –National NAEP & International TIMSS Data • 8th and 12th graders using graphing calculators in class had higher NAEP scores than non-users. • National Center for Education Statistics (2001). The Nation's Report Card: Mathematics 2000. Washington, DC: U.S. Department of Education, Office of Educational Research and Improvement. • 8th-graders in countries allowing frequent access to calculators scored higher on assessment (TIMSS). • Mullis, I.V.S., Martin, M.O., Gonzalez, E.J., & Chrsotwski, S. J. (2003). TIMSS 2003 International Mathematics Report. Boston, MA: International Association for the Evaluation of Educational Achievement (IEA). Available at http://timss.bc.edu/isc/publications.html
Quantity of Use Counts – Algebra 1 In 11 Algebra 1 classes… • The more access students have to graphing calculators during instruction, the higher their end-of-course test scores. • Heller, J. L., Curtis, D.A., Jaffe, R. & Verboncoeur, C.J. (2005). Impact of handheld graphing calculator use on student achievement in Algebra 1. Oakland, CA: Heller Research Associates.
Quantity of Use Counts – State TestData • Schools where teachers assigned graphing calculators for homework had higher TAKS scores than those who did not require them. Dimock, V., & Sherron, T. (2005). Final Report of a Study of the Impact of Graphing Calculator Use on State Assessments. Austin, TX: Educational Development Laboratory (SEDL), Available at http://education.ti.com/sites/US/downloads/pdf/graphing_use_st_assmnts_sedl_2005.pdf
Standardized Test Performance Gains • ‘Students required to provide own calculator’ averaged TAKS scores 36 points higher • Students in 9th grade urban schools requiring ownership averaged 35 points higher; • In rural schools, the advantage was 32 points. • Students using GCs for homework averaged TAKS scores 28 points higher. • Dimock, V., & Sherron, T. (2005). Final Report of a Study of the Impact of Graphing Calculator Use on State Assessments. Austin, TX: Educational Development Laboratory (SEDL), Available at http://education.ti.com/sites/US/downloads/pdf/graphing_use_st_assmnts_sedl_2005.pdf
Quality of Use Counts “…gains in student learning with handheld graphing technology are a function, not simply of the presence of handheld technology, but of how the technology is used...” - Burrill, G., et. al. (2002)
Quality of Use Counts • Fosters deep conceptual understanding • Increases high-level problem-solving strategy • Burrill, G., Allison, J., Breaux, G., Kastberg, S., Leatham, K., & Sanchez, W. (2002). Handheld graphing technology in secondary school mathematics: Research findings and implications for classroom practice. Dallas, TX: Texas Instruments. Available at http://education.ti.com/sites/US/downloads/pdf/CL2872.pdf
Quality of Use Counts – Using TI-NspireTM Technology • Enables multiple representations of concepts • Allows creating, editing and saving of electronic documents
Overall, Which Counts the Most in Handheld Usage? Quality of use Quantity of Use AND
For more information • Visit education.ti.com/research • Download Research Note #3 • Contact Rob Foshay – Director, Education Research, Texas Instruments, Inc. at: R-foshay@ti.com