Download
1 / 18
180 likes | 197 Views
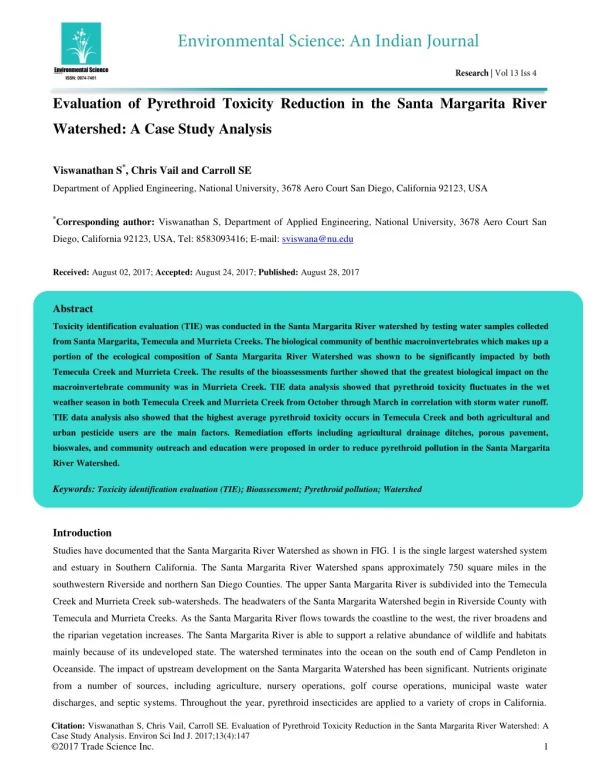
Toxicity identification evaluation (TIE) was conducted in the Santa Margarita River watershed by testing water samples collected from Santa Margarita, Temecula and Murrieta Creeks. The biological community of benthic macroinvertebrates which makes up a portion of the ecological composition of Santa Margarita River Watershed was shown to be significantly impacted by both Temecula Creek and Murrieta Creek. The results of the bioassessments further showed that the greatest biological impact on the macroinvertebrate community was in Murrieta Creek. TIE data analysis showed that pyrethroid toxicity fluctuates in the wet weather season in both Temecula Creek and Murrieta Creek from October through March in correlation with storm water runoff. TIE data analysis also showed that the highest average pyrethroid toxicity occurs in Temecula Creek and both agricultural and urban pesticide users are the main factors. Remediation efforts including agricultural drainage ditches, porous pavement, bioswales, and community outreach and education were proposed in order to reduce pyrethroid pollution in the Santa Margarita River Watershed.

E N D
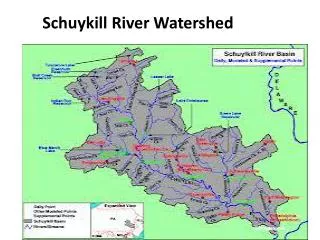
Evaluation of Pyrethroid Toxicity Reduction in the Santa Margarita River Watershed: A Case Study Analysis Viswanathan S*, Chris Vail and Carroll SE Department of Applied Engineering, National University, 3678 Aero Court San Diego, California 92123, USA *Corresponding author: Viswanathan S, Department of Applied Engineering, National University, 3678 Aero Court San Diego, California 92123, USA, Tel: 8583093416; E-mail:sviswana@nu.edu Received: August 02, 2017; Accepted: August 24, 2017; Published: August 28, 2017 Abstract Toxicity identification evaluation (TIE) was conducted in the Santa Margarita River watershed by testing water samples collected from Santa Margarita, Temecula and Murrieta Creeks. The biological community of benthic macroinvertebrates which makes up a portion of the ecological composition of Santa Margarita River Watershed was shown to be significantly impacted by both Temecula Creek and Murrieta Creek. The results of the bioassessments further showed that the greatest biological impact on the macroinvertebrate community was in Murrieta Creek. TIE data analysis showed that pyrethroid toxicity fluctuates in the wet weather season in both Temecula Creek and Murrieta Creek from October through March in correlation with storm water runoff. TIE data analysis also showed that the highest average pyrethroid toxicity occurs in Temecula Creek and both agricultural and urban pesticide users are the main factors. Remediation efforts including agricultural drainage ditches, porous pavement, bioswales, and community outreach and education were proposed in order to reduce pyrethroid pollution in the Santa Margarita River Watershed. Keywords: Toxicity identification evaluation (TIE); Bioassessment; Pyrethroid pollution; Watershed Introduction Studies have documented that the Santa Margarita River Watershed as shown in FIG. 1 is the single largest watershed system and estuary in Southern California. The Santa Margarita River Watershed spans approximately 750 square miles in the southwestern Riverside and northern San Diego Counties. The upper Santa Margarita River is subdivided into the Temecula Creek and Murrieta Creek sub-watersheds. The headwaters of the Santa Margarita Watershed begin in Riverside County with Temecula and Murrieta Creeks. As the Santa Margarita River flows towards the coastline to the west, the river broadens and the riparian vegetation increases. The Santa Margarita River is able to support a relative abundance of wildlife and habitats mainly because of its undeveloped state. The watershed terminates into the ocean on the south end of Camp Pendleton in Oceanside. The impact of upstream development on the Santa Margarita Watershed has been significant. Nutrients originate from a number of sources, including agriculture, nursery operations, golf course operations, municipal waste water discharges, and septic systems. Throughout the year, pyrethroid insecticides are applied to a variety of crops in California. Citation: Viswanathan S, Chris Vail, Carroll SE. Evaluation of Pyrethroid Toxicity Reduction in the Santa Margarita River Watershed: A Case Study Analysis. Environ Sci Ind J. 2017;13(4):147 ©2017 Trade Science Inc. 1
www.tsijournals.com | August-2017 The use of pyrethroids in agriculture became more prolific due to the decline in the use of organophosphate pesticides (pyrethroids are also commonly used in the home in pet sprays and shampoos) [1]. This paper analyzes the toxicity reduction evaluation (TRE)ofpyrethroid pollution in the Santa Margarita River Watershed. FIG. 1. Santa Margarita River Watershed. Literature Review Pyrethrins are natural insecticides that are derived from the extract of chrysanthemum flowers. The dried flowers were used as insecticides in ancient China as long ago as the 1st century AD, and by the middle ages the crushed, dried flowers were found in Persia. Full scale extraction of pyrethrins from flowers began in the mid-19th century [2]. The insecticide became known as ‘Persian Dust’, which was produced from the dried flowers [2]. They are synthetic analogues of the naturally occurring pyrethrins. These chemical compounds are axonic poisons that keep the sodium ion channels open in the neural membranes of insects. The sodium ion channel is a small hole through which sodium ions are permitted to enter the axon and cause excitation. Because the nerves cannot de-excite, the insect becomes paralyzed. A comprehensive survey of pesticide uses in Sacramento, San Diego, and Orange Counties [3,4] concluded that, as the chlorpyrifos and diazinon pesticides have been phased out, and pyrethroid pesticides have been used increasingly. FIG. 2 illustrates the increasing use of pyrethroids is shown both in San Diego County and Orange County. Depending on the application location of these pesticides, they may cause significant threat to aquatic organisms in urban streams [5]. Several studies conducted in the Sacramento-San Joaquin River Delta have identified important transport pathways for pyrethroids [3]. They included agricultural runoff during rain storm events, drift from aerial or ground-based spraying, and intentional 2
www.tsijournals.com | August-2017 release of agricultural tailwaters [6]. The esfenvalerate and permethrin, part of pyrethroids family were transported offsite from agricultural areas into surface waters during winter rainstorm events occurred during February and March 2003 [7]. FIG. 2. Pyrethroids use trends San Diego and Orange County. Pyrethroids often enter receiving waters through transport from surface runoff into storm water (also known as MS4 and/or non-point runoff) directly, and then into the receiving waters [6,8]. Other potential sources are run-off from irrigation with reclaimed water, application overspray, and atmospheric deposition. Pyrethroids transported via the storm water, from whatever source, are considered non-point discharges. Due to low vapor pressures and Henry’s Law constants, pyrethroids are not easily volatilized into the atmosphere. In addition, they tend to dissolve into lipids due to high water partition coefficients. The greatest risk of pyrethroid exposure to aquatic organisms is from contaminated sediments because of high organic carbon partition coefficients. Although pyrethroids may bioconcentrate, depuration is rapid, and bioaccumulation through the food web is not a significant route of exposure [9]. Pyrethroids have a tendency to adsorb to surfaces of suspended particulate materials in the water column including clay, soils, sediment particles, and organic matter, which act as primary vectors for pyrethroid transport through aquatic systems [1,10]. Anderson et al. [11] conducted a weight-of-evidence study on pesticide pollution in the Santa Maria River watershed in central California. The Santa Maria River divides San Luis Obispo County to the north, and Santa Barbara County to the south. The Santa Maria River provides significant freshwater and coastal habitat in a semi-arid region of central California. The lower river is a primary migration corridor for endangered steelhead trout (Oncorhynchus mykiss), and the Santa Maria River estuary provides an important aquatic habitat for numerous marine and estuarine fish species. The estuary of this river also supports numerous sensitive shorebird species [11]. The Santa Maria River is heavily influenced by winter rainfall occurring primarily from November through March. In this study, the impacts of the agricultural drain water were investigated at six stations in the Santa Maria watershed over a period of twelve months. One of these stations was in the upper Santa Maria watershed and five in the lower watershed. Possible causes of toxicity and impacts on macroinvertebrate community structure were investigated using a combination of TIEs and chemical analysis, dose-response information from the literature, and physical habitat assessments [11,12]. The TIE evidence from this study suggested that pesticide toxicity was caused by a combination of different types of pesticides including pyrethroids, organophosphates, and chlorpyrifos. Based on the LC50 survival studies of amphipods such as Hyalella 3
www.tsijournals.com | August-2017 azteca, the pyrethroid that most likely contributed to the pesticide pollution in this river was permethrin. Results of statewide monitoring programs allowed the comparison of the sediment samples and LC50 survival values from the Santa Maria River versus other rivers in the state, and the comparison indicated that the pyrethroid pollution in the Santa Maria River was the highest pyrethroid pesticide pollution statewide. Materials and Methods The primary sources of data utilized for this TRE are bioassessment data and toxicity identification evaluation (TIE) data [13]. Secondary data consisting of pesticide/pyrethroid use, pyrethroid user groups, land use, and population are also evaluated. Bioassessments are performed on the Santa Margarita River at each of the major tributaries, Temecula Creek and Murietta Creek, as well as on a control site, which is along the watershed of Adobe Creek. Bioassessments are performed twice a year within the dry season for the Santa Margarita River, between the months of May and October. There are two parts to performing a bioassessment: 1) collecting physical habitat data and 2) collecting taxonomic data in the form of in- stream biological samples of aquatic invertebrates. Physical habitat data was collected in accordance with the California Stream Bioassessment Protocol (CSBP). In accordance with CSBP, once the stream location has been reached, a 100-meter length section of the stream is selected which contains at least three riffles. At each riffle, a transect (sampling area) was established perpendicular to the flow from which three separate areas of the transect of 0.18 m² were sampled upstream of a 0.3 m-wide D-frame net [14]. The selected transects of these riffles are the areas in which biological samples were collected. A total of 1.82 m² of substrate was sampled per reach and approximately 900 organisms were sub-sampled from this material (approximately 300 organisms were sampled from each of the 3 transects) [14]. When the bioassessment was performed, the collection of the macroinvertebrates was collected prior to a physical habitat analysis. A benthic macroinvertebrate index of biological integrity (B-IBI) was developed for the San Diego region by Viswanathan et al. [15]. The seven-selected metrics for this B-IBI were as follows: 1) percent collector-gatherer+collector-filterer individuals (% collectors), 2) percent non-insect taxa, 3) percent tolerant taxa, 4) Coleoptera richness, 5) predator richness, 6) percent intolerant individuals, and 7) EPT richness. Based on these seven metrics, the biological health of a stream can be categorized on a scale of 0-100 as follows: 0-19=“very poor”, 20-39=“poor”, 40-59=“fair”, 60-79=“good” and 80-100=“very good”. This categorization enables stewards to quantify the health of a stream and make comparisons between the health of one stream and another based on the sampling of benthic macroinvertebrates. A TIE has three stages which are simply referred to as Phase I, Phase II, and Phase III. Guidelines for conducting TIEs have been published by the USEPA. These guidelines provide a comprehensive framework and overall process for identifying unknown toxic agents; however, recent innovations and alternative processes for achieving the same objectives also exist. In the case of the Santa Margarita River watershed, pyrethroid exposure can be classified as acute exposure. Pyrethroid exposure in the Santa Margarita River watershed occurs during the wet season for southern California [16]. This wet season is primarily from November through March. The acute exposure of the Santa Margarita River to pyrethroids during storm events made the application of Phases I and II of the TIE the most applicable in this case. Conducting all three phases is not 4
www.tsijournals.com | August-2017 mandatory for a successful TIE, but the phases are intended to aid those who need to characterize, identify, or confirm the cause of toxicity in effluents or other aqueous samples such as ambient waters, sediments, and leachates. The first step in the biological sample collection was random selection of sampling areas (transects) within the three selected riffles. This was conducted by assigning numbers which correlated to each transect section of a riffle. The number which was correlated to each transect section of the riffle was then randomly selected. Once a random number had been selected, that transect section of the riffle was then sampled. One person held a large net downstream of their partner while the field member moved rocks and sediment up from the stream bottom. As these rocks and sediments were disturbed, macro-invertebrates were evacuated from the debris on the bottom and were carried via the current in the stream to the collection net. This sample of these invertebrates was placed within a jar or similar container, and was then sent to a lab to be analyzed. This analysis consisted of identification of the taxa of the macro- invertebrates (taxa data) as well as measurements of the abundance and size of individual taxa within the sample (metrics data). Both taxa data and metrics data were interpreted to determine the SoCal IBI index rating of the stream. This TRE analysis is based on data provided from the bioassessment and the TIE of the Santa Margarita River. The bioassment data was examined to assess the benthic macroinvertebrate biological integrity of each creek – Temecula, Murietta, and Adobe – within the Santa Margarita watershed. The TIE data was analyzed to identify which of these creeks (Temecula, Murietta, or Adobe) was most impacted by pyrethroid pollution. This was calculated by averaging the toxicity units (TU) from all samples over time at each creek. The TU from each creek was also examined over time to analyze whether the pyrethroid pollution was accumulating. Results and Discussion There are total of eight monitoring stations in the Santa Margarita watershed within Riverside County. Two main triad stations, Temecula Creek and Murrieta Creek are of primary importance to this TRE. The third triad station is the control station which varies based on dry weather or wet weather sampling. Adobe Creek is considered to be the control site and dry weather triad station because it is not within the drainage boundaries of the Santa Margarita watershed. Cole Creek is the third triad station used during wet weather sampling as a control. The remaining four stations are tributary stations. Wet weather samples are collected from all eight sites when possible. Since wet weather sampling is based on storm events, a set sampling schedule was not possible. Dry weather sampling, including bioassessments, was also collected from the three triad stations [17]. FIG. 3 shows the pyrethroid use within Riverside County over the past ten years. It depicts the steady increase in the use of pyrethroids from 2003 through 2006. The most common pyrethroid, permethrin, grew from over 10,000 lbs. applied in 2003 to over 100,000 lbs. applied in 2006. This represents a ten-fold increase in that time frame. The increase in pyrethroid use in Riverside County can in part be attributed to the constantly increasing population and urbanization of the area surrounding the Santa Margarita River watershed. All of these lead to an increase in storm water runoff, which is the cause of pyrethroid pollution. Third, the increasing population also leads to an expansion of residential areas surrounding the Santa Margarita 5
www.tsijournals.com | August-2017 River Watershed. The storm water runoff increases as the residential areas expand closer to the drainage areas of the watershed. This runoff is a conduit for pyrethroid pollution due to residential pesticide use. FIG. 3. Pyrethroid application in Riverside County. FIG. 4 shows the different types and amount of pyrethroids used in landscape maintenance in Riverside County. Permethrin, followed by bifenthrin, are the most commonly used pyrethroids for this purpose. FIG. 4 also indicates that the range of use in pounds for landscape maintenance is much smaller than the range used for structural pest control. 6
www.tsijournals.com | August-2017 FIG. 4. Landscape maintenance pyrethroid usages in Riverside County in 2006. FIG. 5 depicts nursery pyrethroid use in Riverside County. The data in this figure shows that outdoor container grown plants, field grown plant nurseries, and nurseries that grow their plants in containers inside greenhouses are the largest users of pyrethroids. It is logical that outdoor container grown plants and field grown plant nurseries are the largest users of pyrethroids because these chemicals are normally sprayed outdoors. Nurseries which utilize greenhouses to grow their plants may be spraying pyrethroids on the outside of their greenhouses to prevent insects from entering. 7
www.tsijournals.com | August-2017 FIG. 5. Nursery pyrethroid usages in Riverside Country in 2006. Bioassessment data was gathered on two types of parameters: aquatic macroinvertebrate taxa and physical habitat. Data on both of these parameters were collected as part of a bioassessment study in the fall and spring of each year. They consist of four sampling periods: Oct. 2006, May 2007, Oct. 2007, and May 2008. TABLE 1 displays the data for the physical habitat surveys for this study for the year 2008. The physical habitat scores in TABLE 1 are the mean habitat characteristics which contain information to describe the physical nature of each stream. The physical habitat was scored by measuring twelve different parameters to arrive at a cumulative score and a relative ranking. The relative ranking gives an easy description of the quality of the physical habitat of the stream. For the purposes of this study this ranking is the most important. Lastly, in the physical habitat tables is the water quality section which notes four water quality parameters at the time the physical habitat measurements were taken. When the qualitative rating for the physical habitat scores was compared, no variation was observed over these four sampling periods. Murrieta Creek was rated as “sub-Optimal”, Temecula Creek was rated as “marginal”, and Adobe Creek was rated as “optimal”. The data showed that Murrieta Creek had better physical habitat than Temecula Creek. Adobe Creek was a suitable control because of its “optimal” physical habitat. The fact that these qualitative ratings were consistently maintained across all four sampling periods in each of these creeks indicates that physical habitat degradation was not a factor in aquatic macroinvertebrate mortality during this period of time. 8
www.tsijournals.com | August-2017 TABLE 1. Santa Margarita Watershed physical habitat data collected in May 2008. Physical habitat scores and characteristics Spring 08 bioassessment Sampling performed: 5/14/2008 Parameter Sampling site Murrieta Creek Temecula Creek Adobe Creek Physical habitat scores Epifaunal substrate cover 9 1 17 Embeddedness 16 1 14 Velocity/depth regime 14 10 14 Sediment deposition 17 1 19 Channel flow status 7 4 15 Channel alteration 18 14 20 Riffle frequency 8 8 8 Bank stability 17 13 17 Vegetative protection 17 16 18 Riparian vegetative zone 15 13 16 Reach total 138 81 158 Qualitative Sub-optimal Marginal Optimal rating Mean habitat characteristics1 Reach length (m) 100 100 100 Average riffle length (m) 3.5 8.0 4.3 Average riffle width (m) 0.51 0.79 0.81 Average riffle depth (cm) 15.1 3.7 4.7 Riffle velocity (m/sec) 0.58 0.30 0.61 % Canopy cover 64 83 98 Substrate complexity low low high Embeddedness low high low Substrate consolidation high low moderate Gradient (%) 1 1 1 Substrate composition (%): Fines (<0.1 5 80 10 in.) Gravel (0.1- 5 20 60 2.0 in.) Cobble (2-10 0 0 27 in.) 9
www.tsijournals.com | August-2017 Boulder (>10 2 0 3 in.) Bedrock 88 0 0 (solid) Water quality Water temperature (°C) 23.2 20.5 15.5 pH (pH units) ns ns ns Dissolved oxygen (mg/L) ns ns ns Specific conductance (µS/cm) ns ns ns 1Average of three riffles sampled ns not sampled Raw data from aquatic macroinvertebrate sampling from May 2008 is shown in TABLE 2 (taxa data) and measurements of the abundance and size of individual taxa within the sample (metrics data) is shown in TABLE 3 for Temecula Creek. These metrics table sort the invertebrate’s samples by order, and they list the number of insects from each particular family in each order. These measures of abundance were used to calculate the SoCal B-IBI data for May 2008. TABLE 2. Taxa Data for Temecula Creek collected from May 2008. Taxa data May 2008 Temecula Creek Site TC-1 TC-2 TC-3 Time Date 10:15 05-14- 2008 18.08 5176.1-1 0 61 14 0 0 2 1 3 0 239 0 2 3 10 94 2 0 1 2 09:55 05-14- 2008 29.15 5176.1-2 0 11 10 0 0 1 1 0 1 330 0 0 5 12 63 0 1 2 3 09:20 05-14- 2008 34.36 5176.1-3 0 6 12 1 1 0 0 0 1 386 8 0 7 5 32 0 1 4 15 Percent sub-sampled EcoAnalysts sample ID Baetidae Baetis sp. Fallceon sp. Tricorythodes sp. Agabus sp. Enochrus sp. Hydraena sp. Laccobius sp. Stictotarsus sp. Chironomidae Ceratopogonidae Ceratopogoninae Dolichopodidae Ephydridae Euparyphus sp. Hedriodiscus/Odontomyia sp. Hemerodromia sp. Muscidae Pericoma/Telmatoscopus sp. Ephemeroptera Coleoptera Diptera-Chironomidae Diptera 10
www.tsijournals.com | August-2017 73 2 0 0 0 0 0 509 121 0 1 6 0 2 1 571 95 0 0 0 2 0 0 576 Simulium sp. Stratiomys sp. Hydropsyche sp. Naididae Acari Sperchon sp. Turbellaria Total Trichoptera Acari Other organisms P.S: Only data with value above zero are listed in this table TABLE 3. Taxa metrics for Temecula Creek May 2008. Taxa Metrics May 2008 Temecula Creek Site Time Date Percent Sub-sampled EcoAnalysts sample ID Abundance measures Corrected abundance EPT abundance Dominance measures Dominant taxon Dominant abundance 2nd Dominant taxon 2nd Dominant abundance 3rd Dominant taxon 3rd Dominant abundance % Dominant taxon % 2 Dominant taxa % 3 Dominant taxa Richness measures Species richness EPT richness Ephemeroptera richness Trichoptera richness Chironomidae richness Oligochaeta richness Non-chiro. Non-olig. richness Community composition % Ephemeroptera % Trichoptera % EPT % Coleoptera % Diptera % Oligochaeta TC-1 TC-2 TC-3 10:15 05-14-2008 18.08 5176.1-1 2814.77 414.75 Chironomidae 1321.67 Euparyphus sp. 519.82 Simulium sp. 403.69 46.95 65.42 79.76 15.00 2.00 2.00 0.00 1.00 0.00 14.00 14.73 0.00 14.73 1.18 84.09 0.00 09:55 05-14-2008 29.15 5176.1-2 1958.53 75.46 Chironomidae 1131.90 Simulium sp. 415.03 Euparyphus sp. 216.09 57.79 78.98 90.02 17.00 3.00 2.00 1.00 1.00 1.00 15.00 3.68 0.18 3.85 0.53 94.05 1.05 09:20 05-14-2008 34.36 5176.1-3 1676.16 55.29 Chironomidae 1123.26 Simulium sp. 276.45 Euparyphus sp. 93.12 67.01 83.51 89.06 15.00 3.00 3.00 0.00 1.00 0.00 14.00 3.30 0.00 3.30 0.35 96.01 0.00 11
www.tsijournals.com | August-2017 % Baetidae % Chironomidae % Hydropsychidae % Simuliidae Functional group composition % Filterers % Gatherers % Predators % Scrapers % Shredders % Unclassified Filterer richness Gatherer richness Predator richness Shredder richness Unclassified Diversity/Evenness measures Shannon-Weaver H' (log 10) Shannon-Weaver H' (log 2) Shannon-Weaver H' (log e) Margalef's richness Pielou's J' Simpson's heterogeneity Biotic indices % Indiv. w/HBI value Hilsenhoff biotic index % Indiv. w/MTI value Metals tolerance index % Indiv. w/FSBI value Fine sediment biotic index FSBI-average FSBI-weighted average % Indiv. w/TPM value Temp. pref. metric-average TPM-weighted average Karr BIBI metrics Clinger richness % Clingers % Tolerant individuals % Tolerant taxa Coleoptera richness Montana DEQ metrics MT biotic index C-gatherers+C-filterers % Scraper+%Shredder % Univoltine 14.73 46.95 0.00 14.34 14.34 78.19 1.38 0.00 2.55 3.54 1.00 5.00 4.00 2.00 3.00 0.68 2.26 1.57 1.76 0.58 0.71 96.07 6.09 46.17 4.31 26.72 12.00 0.80 3.48 61.69 1.07 5.01 3.00 26.52 3.48 6.67 3.00 6.09 92.53 2.55 66.01 3.68 57.79 0.18 21.19 21.37 72.33 2.28 0.00 2.10 1.93 2.00 5.00 7.00 1.00 2.00 0.58 1.93 1.34 2.11 0.47 0.61 97.55 5.96 37.13 4.60 23.99 22.00 1.29 3.15 79.68 1.06 5.00 4.00 23.47 3.30 5.88 3.00 5.96 93.70 2.10 69.88 3.13 67.01 0.00 16.49 16.49 76.39 4.17 0.00 0.87 2.08 1.00 5.00 7.00 1.00 1.00 0.52 1.73 1.20 1.89 0.44 0.52 97.74 5.85 29.17 4.64 20.49 21.00 1.40 3.33 86.46 1.40 5.02 4.00 18.06 1.95 6.67 2.00 5.85 92.88 0.87 74.31 12
www.tsijournals.com | August-2017 % Multivoltine Lake metrics % Individuals w/CAHBI value % Non-insect individuals % Non-insect taxa Average abundance (per taxon) NYDEC PMA metrics % Non-Chironomidae P.S: Data shown only for variables above zero value 29.27 29.47 0.00 0.00 187.70 53.05 26.27 26.97 1.58 17.65 115.20 40.63 23.44 23.78 0.35 6.67 111.7 32.6 TABLE 4 displays the calculations of the SoCal B-IBI score for Temecula Creek in May 2008. The SoCal IBI is the most comprehensive assessment to date of freshwater biological integrity in southern California which causes it to be considered the standard in this region. This index of biological integrity uses seven selected metrics obtained from benthic macroinvertebrate sampling. The corresponding metrics from Murrieta Creek, and Adobe Creek were used to calculate the SoCal B-IBI for the respective streams and associated quantitative measure of the biological health of the streams. TABLES 5 and 6 display the SoCal B-IBI scores along with the qualitative rating of the biological health of Murrieta Creek, and Adobe Creek, respectively. These scores correlate to qualitative rating of each stream’s biological health. TABLE 4. SoCal IBI score summary for Temecula Creek May 2008. Site TC-1 10:15 05-14-2008 18.08 5176.1-1 Value 3.00 2.00 4.00 92.53 0.00 0.00 6.67 TC-2 09:55 05-14-2008 29.15 5176.1-2 Value 3.00 3.00 7.00 93.70 0.00 17.65 5.88 TC-3 09:20 05-14-2008 34.36 5176.1-3 Value 2.00 3.00 7.00 92.88 0.00 6.67 6.67 Collection time Collection date % Subsampled EcoAnalysts sample ID Score 5.00 1.00 1.00 1.00 0.00 10.00 9.00 Score 5.00 1.00 4.00 1.00 0.00 7.00 9.00 Score 4.00 1.00 4.00 1.00 0.00 10.00 9.00 Coleoptera Taxa EPT taxa Predator taxa % Collector individuals % Intolerant individuals % Non-insect taxa % Tolerant taxa SoCal B-IBI 27 39 27 39 40 29 41 x1.43 Mean Score rating: 0-19 – very poor; 20-39 – poor; 40-59–fair; 60-79 – good; 80-100 – very good The SoCal B-IBI scores from the most recent sampling period of May 2008 are indicative of the current biological health of these creeks in the Santa Margarita River Watershed. In TABLE 4, Temecula Creek has a mean SoCal B-IBI score of 40 which correlates to a qualitative rating of “fair” biological health. In TABLE 5, Murrieta Creek has a mean SoCal B-IBI score of 11 which correlates to a qualitative rating of “very poor” biological health. Since this is the lowest qualitative rating available, the biological health of Murrieta Creek can be considered to be very impacted. Some or all of this impact could be associated with pyrethroid pollution. In TABLE 6, Adobe Creek has a mean SoCal B-IBI score of 68 which correlates to a 13
www.tsijournals.com | August-2017 qualitative rating of “good” biological health. This score and rating makes Adobe Creek an appropriate control in this experiment because its biological health is minimally impacted. TABLE 5. SoCal IBI score summary for Murrieta Creek May 2008. Site MC-1 12:20 05-14-2008 24.27 5176.1-4 Value 0.00 2.00 6.00 94.24 MC-2 11:30 05-14-2008 100.00 5176.1-5 Value 1.00 0.00 4.00 91.64 MC-3 11:05 05-14-2008 7.29 5176.1-6 Collection time Collection date %Subsampled EcoAnalysts sample ID Score 0.00 1.00 3.00 1.00 Score 2.00 0.00 1.00 2.00 Value 0.00 1.00 6.00 95.17 Score 0.00 0.00 3.00 1.00 Coleoptera taxa EPT taxa Predator Taxa % Collector individuals % Intolerant individuals % Non-Insect taxa % Tolerant taxa SoCal B-IBI 0.38 0.00 0.00 0.00 0.00 0.00 38.89 33.33 2.00 2.00 29.41 35.29 5.00 1.00 50.00 38.89 0.00 0.00 9 13 11 16 4 6 x1.43 Mean 11 Score rating: 0-19 – very poor; 20-39 – poor; 40-59–fair; 60-79 – good; 80-100– very good TABLE 6. SoCal IBI score summary for Adobe Creek May 2008. Site AC-1 15:50 05-14-2008 5.95 5176.1-7 Value 4.00 11.00 8.00 67.15 32.31 24.24 21.21 AC-2 15:25 05-14-2008 6.25 5176.1-8 Value 7.00 9.00 12.00 59.67 28.73 22.50 15.00 AC-3 14:55 05-14-2008 17.70 5176.1-9 Value 4.00 8.00 9.00 71.40 21.40 35.48 22.58 Collection time Collection date %Subsampled EcoAnalysts sample ID Score 7.00 6.00 5.00 8.00 10.00 6.00 5.00 Score 10.00 5.00 9.00 9.00 10.00 6.00 7.00 Score 7.00 4.00 6.00 7.00 8.00 3.00 4.00 Coleoptera taxa EPT taxa Predator taxa % Collector individuals % Intolerant individuals % Non-Insect taxa % Tolerant taxa SoCal B-IBI 47 67 56 80 68 39 56 x1.43 Mean Score rating: 0-19 – very poor; 20-39 – poor; 40-59-fair; 60-79 – good; 80-100 – very good Hyalella azteca was used as the indicator species to test for pyrethoid toxicity. Acute survival studies were conducted with water samples from Temecula Creek, Murrieta Creek, and Adobe or Cole Creek. These acute survival studies were used to determine LC50 values. The LC50 (an abbreviation for Lethal Concentration for 50%) values indicate the percentage of the 14
www.tsijournals.com | August-2017 water sample required to kill 50% of the test organisms. This value was then used to calculate the toxicity unit (TU) value. The TU value is a quantitative measure of the pyrethroid toxicity in that creek at the time the sample was taken. TABLE 7 summarizes the Pyrethroid toxicity data sorted by date for Temecula Creek. Similar data were calculated for Murrieta Creek, and Adobe and Cole Creeks. The mean TU value for each creek was calculated to determine an overall level of toxicity for each creek. In FIG. 6 pyrethroid toxicity versus time was plotted to determine the trends over time in Temecula Creek, Murrieta Creek, and Adobe and Cole Creeks, respectively. The trend seen in this figure helps define which creek carries the most toxicity through its system, therefore allowing the correlation of land use to toxicity within the watershed. This figure shows the toxicity of Temecula Creek and Murrieta Creek runs parallel to each other over the study period whereas the toxicity of the two control creeks remains relatively constant. TABLE 7. Temecula Creek TU calculation. Sample number Sample date Creek Test species and endpoint NOEC (% sample) LC50/EC50 TU value (% sample) 1 10/18/2005 Temecula Hyalella: Acute survival 25 27.3 3.66 2 2/27/2006 Temecula Hyalella: Acute survival 100 >100 1 3 3/11/2006 Temecula Hyalella: Acute survival 25 40.7 2.46 4 3/28/2006 Temecula Hyalella: Acute survival <25 18.8 5.33 5 4/20/2007 Temecula Hyalella: Acute survival <25 15.8 6.32 6 10/16/2007 Temecula Hyalella: Acute survival 100 >100 0.41 7 11/30/2007 Temecula Hyalella: Acute survival <25 20.6 4.9 8 12/7/2007 Temecula Hyalella: Acute survival <25 31.5 3.2 9 1/26/2008 Temecula Hyalella: Acute survival <25 12.5 8 10 5/14/2008 Temecula Hyalella: Acute survival 100 >100 0.77 mean TU 3.605 15
www.tsijournals.com | August-2017 FIG. 6. Pyrethroid toxicity over time for the three creeks studied. FIG. 7 represents the mean toxicity units for the triad creeks. It shows that Temecula Creek and Murrieta Creek are the ones contributing the most pyrethroid toxicity to this watershed. Temecula Creek obviously contributes the highest amount of pyrethroid toxicity to the Santa Margarita River Watershed with a mean TU score of 3.605. It was noteworthy that the SoCal B-IBI score, as shown in TABLE 4, for Temecula Creek indicated “fair” biological health. Temecula Creek was rated as “marginal” with regards to its physical habitat score as shown in TABLE 1. The second largest percentage of land use is found to be rural, and thus the pesticide use is unregulated. Of the regulated pesticide users in this area, agricultural (9.5%) and residential (3.3%) land uses are the predominant pesticide users in this area. Remedying the amount of pyrethroid contribution from these two user groups should be part of the remediation effort for pyrethroid pollution in the Temecula Creek drainage area. 16
www.tsijournals.com | August-2017 Average Toxicity Units 4 3.5 3 2.5 2 3.6 1.5 2.18 1 0.5 0.32 0.41 0 Adobe Creek Cole Creek Murieta Creek Temecula Creek Adobe Creek Cole Creek Murieta Creek Temecula Creek FIG. 7. Average toxicity units (TU) for triad creeks. Murrieta Creek has the second highest pyrethroid contribution to the Santa Margarita River watershed with a mean TU score of 2.1767. Murrieta Creek did not have the highest amount of pyrethroid toxicity in the stream; however, pyrethroid toxicity in this stream had the greatest impact on its invertebrate population. As shown, Murrieta Creek had a mean SoCal B-IBI score of 11 which correlated to a qualitative rating of “very poor” biological health. Since this was the lowest qualitative rating available, the biological health of Murrieta Creek was considered to very impacted. The physical habitat scores further emphasized the impact of pyrethroid pollution on Murietta Creek. Murrieta Creek was rated as “sub-optimal” with regards to its physical habitat score and Temecula Creek was rated as “marginal” (TABLE 1). Murrieta Creek had better physical habitat than Temecula Creek, but the invertebrate community within Murrieta Creek was more severely impacted despite the better physical habitat. The two largest land uses in this area are also undesignated and rural. As previously discussed, these users are not required to report their pesticide use. In the Murrieta Creek drainage area, the two-greatest regulated pesticide user groups are agricultural (14.01%) and residential (5.39%) pesticide users. These are the same regulated user groups which dominate the pyrethroid pollution in the Temecula Creek drainage area. This commonality suggests that remediation efforts for pyrethroid pollution in the Santa Margarita River watershed should focus on curtailing the pyrethroid pollution from these two user groups. Conclusion The purpose of a toxicity reduction evaluation (TRE) is to determine what is causing the toxicity within the watershed and to develop options to mitigate the contamination. The scientific evidence produced through this project showed that the main causes of pyrethroid toxicity within the Santa Margarita watershed is storm water runoff from agricultural and residential sources entering Temecula Creek and Murrieta Creek. Any mitigation plan developed to minimize/eliminate the pyrethroid must include storm water runoff from agricultural and residential sources including public education programs for user groups. 17
www.tsijournals.com | August-2017 REFERENCES 1.Oros DR, Werner I. Pyrethroid Insecticides: An Analysis of Use Patterns, Distributions, Potential Toxicity and Fate in the Sacramento-San Joaquin Delta and Central Valley. University of California, Davis. 2005. 2.Davies TGE, Field LM, Usherwood PNR, et al. DDT, pyrethrins, pyrethroids and insect sodium channels. Life. 2007;59(3):151-62. 3.Wilen CA, Kreidich NI, Flint ML, et al. Tracking Non-residential Pesticide Use in Urban Areas of California. University of California. 2005. 4.Anderson B, Phillips B, Hunt J, et al. Impacts of pesticides in a Central California estuary. Environ Monit Assess. 2014;186(3):1801-14. 5.Moran K. Insecticide market trends and potential water quality implications. Report for the San Francisco Estuary Project. TDC Environmental, San Mateo, CA. 2003 6.TDC Environmental. Pesticides of Interest for Urban Surface Water Quality: Urban Pesticides Use, Trends Annual Report July. 2008;p:1-46. 7.Bacey J, Spurlock F, Starner K, et al. Residues and toxicity of esfenvalerate and permethrin in water and sediments, in tributaries of the Sacramento and San Joaquin Rivers, California, USA. Bull Environ Contam Toxicol. 2005;74(5):864-71. 8.Carpenter KD, Kuivila KM, Hladik ML, et al. Storm-event-transport of urban-use pesticides to streams likely impairs invertebrate assemblages. Environ Monit Assess. 2016;188(6):345-62. 9.Hill IR, Shaw JL, Maund SJ. Review of aquatic field tests with pyrethroid insecticides. In: Hill IR, editor. Freshwater Field Tests Hazard Assessment of Chemicals. Boca Raton: Lewis Publisher, USA; 1994;p:249-71. 10.Maruya KA, Dodder NG, Sengupta A, et al. Multimedia screening of contaminants of emerging concern (CECS) in coastal urban watersheds in Southern California (USA). Environ Toxicol Chem. 2016;35(8):1986-94. 11.Anderson BS, Phillips BM, Hunt JW, et al. Evidence of pesticide impacts in the Santa Maria River Watershed, California, USA. Environ Toxicol Chem. Vol. 2006;25(4):1160-70. 12.Hall L, Anderson R. Relationship of bifenthrin sediment concentrations to grain size and total organic carbon in California waterbodies: Implications for ecological risk. Bull Environ Contam Toxicol. 2014;93(6):764-8. 13.Amweg EL, Weston DP, Ureda NM. Use and toxicity of pyrethroid pesticides in the Central Valley, California, USA. Environ Toxicol Chem. 2005;24(4):966-72. 14.Ode PR, Rehn AC, May JT. A quantitative tool for assessing the integrity of southern coastal California streams. Environ Manage. 2005;35(4):493-504. 15.Viswanathan S, Pohlman A, Gibson D, et al. Evaluation of the biocriteria of streams in the San Diego hydrogeologic region. J Environ Eng. 2009;136(6):627-37. 16.MACTEC Engineering and Consulting, Inc. SMR Pyrethroid Source Identification TRE, June 2008. 17.MACTEC Engineering and Consulting, Inc. SMR Annual Report, September 2007. 18