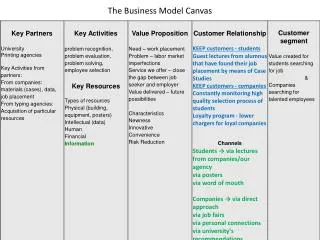
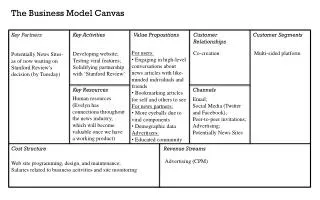
The Canvas
The Canvas. Creating Graphics for the Web . Doncho Minkov. Telerik Software Academy. http://academy.telerik.com. Senior Technical Trainer. http://minkov.it. Table of Contents. Overview and usage of the canvas Drawing shapes Rectangles, arcs and ellipses Lines, paths and Bézier curves

The Canvas
E N D
Presentation Transcript
The Canvas Creating Graphics for the Web Doncho Minkov Telerik Software Academy http://academy.telerik.com Senior Technical Trainer http://minkov.it
Table of Contents • Overview and usage of the canvas • Drawing shapes • Rectangles, arcs and ellipses • Lines, paths and Bézier curves • Per-pixel manipulations
Table of Contents (2) • Canvas styles • fillColor and strokeColor • Gradients, patterns and shadows • Transformations • Save and restore context state • Translate
The Canvas • The Canvas is the way to draw in the browser • Uses JavaScript for the drawing • Enables high-performance drawing • The Canvas is part of the HTML5 specification • Supported in most browsers • Both desktop and mobile
Using the Canvas • The Canvas is a rectangular sheet • All the drawing is done inside this sheet • The canvas consists of: • <canvas> HTML element • JavaScript API for the drawing <canvas id="the-canvas" width="100" height="100" /> Set width and height var canvas = document.getElementById("the-canvas"); varcanvasCtx = canvas.getContext("2d"); canvasCtx.fillRect(10, 10, 30, 30);
The Canvas Context • The canvas HTML element provides many ways for drawing • Rectangular 2d drawing • 3d drawing • WebGL drawing • HTML5 provides APIs for all these types of drawing • The way to use a specific canvas API is to get the corresponding context
Using the Canvas Live Demo
Canvas Shapes • The Canvas provides ways to draw all kinds of shapes • Rects, arcs, ellipses, lines, etc… • Each of these shapes can be either • Drawn in full color (i.e. filled) • Drawn only their border (i.e. stroked) var canvas = document.getElementById("the-canvas"); varcanvasCtx = canvas.getContext("2d"); canvasCtx.fillRect(10, 10, 25, 25); canvasCtx.strokeRect(10, 10, 25, 25);
Drawing Rects • Drawing rects is the simplest way to draw with the canvas • Build-in functionality • context.fillRect (x, y, width, height) • Creates a rectangular shape at position (x, y) from the top left corner of the canvas • The shape is drawn in full color • context.strokeRect (x, y, width, height) • Same as fillRect • Only the border of the shape is drawn
Drawing Rects: Example • Drawing a rectangle filled with light blue and with dark blue border <canvas id="rects-canvas"> </canvas> var canvas = document.getElementById("rects-canvas"), ctx = canvas.getContext("2d"); ctx.fillStyle= "rgb(107, 187, 201)"; ctx.strokeStyle= "rgb(2, 55, 155)"; ctx.fillRect(20, 20, 140, 90); ctx.strokeRect(20, 20, 140, 90);
Drawing Rectangles Live Demo
Canvas Paths • The Canvas can do much more than just drawing rectangles • Bezier curves, ellipses, arcs • Much of the power of the Canvas comes from the path • The path is just a set of connected dots • Depending on the method used, the dots can be connected using straight line or curve
Canvas Path (2) • The canvas context has methods for paths: • beginPath() • Starts path • moveTo(x, y) • Changes the position of the path marker • lineTo(x, y) • Draws a straight line from the position of the path marker to position (x, y) • fill() / stroke() • Fills or strokes the path
Using the Path Live Demo
How the Canvas Works? • The canvas only marks dots on the canvas sheet • And remembers how these dots are connected • When fill() or stroke() is reached, all dots are connected at once ctx.beginPath(); ctx.moveTo(50, 50); ctx.lineTo(50, 300); ctx.lineTo(200, 50); ctx.lineTo(50, 50); ctx.stroke(); ctx.beginPath(); ctx.moveTo(200, 50); ctx.lineTo(200,300); ctx.lineTo(50, 300); ctx.closePath(); ctx.fill();
How the Canvas Works? • canvas.beginPath() tells the Canvas that a new path is started ctx.beginPath(); ctx.moveTo(50, 50); ctx.lineTo(50, 300); ctx.lineTo(200, 50); ctx.lineTo(50, 50); ctx.stroke(); ctx.beginPath(); ctx.moveTo(200, 50); ctx.lineTo(200,300); ctx.lineTo(50, 300); ctx.closePath(); ctx.fill();
How the Canvas Works? • moveTo(50, 50) moves the canvas marker to position (50, 50), relatively to the top left corner ctx.beginPath(); ctx.moveTo(50, 50); ctx.lineTo(50, 300); ctx.lineTo(200, 50); ctx.lineTo(50, 50); ctx.stroke(); ctx.beginPath(); ctx.moveTo(200, 50); ctx.lineTo(200,300); ctx.lineTo(50, 300); ctx.closePath(); ctx.fill();
How the Canvas Works? • lineTo(50, 300) marks a straight line between dots with coordinates (50, 50) and (50, 300) ctx.beginPath(); ctx.moveTo(50, 50); ctx.lineTo(50, 300); ctx.lineTo(200, 50); ctx.lineTo(50, 50); ctx.stroke(); ctx.beginPath(); ctx.moveTo(200, 50); ctx.lineTo(200,300); ctx.lineTo(50, 300); ctx.closePath(); ctx.fill();
How the Canvas Works? • lineTo(200, 50) marks a straight line between dots with coordinates (50, 300) and (200, 50) ctx.beginPath(); ctx.moveTo(50, 50); ctx.lineTo(50, 300); ctx.lineTo(200, 50); ctx.lineTo(50, 50); ctx.stroke(); ctx.beginPath(); ctx.moveTo(200, 50); ctx.lineTo(200,300); ctx.lineTo(50, 300); ctx.closePath(); ctx.fill();
How the Canvas Works? • lineTo(50, 50)marks a straight line between dots with coordinates (200, 50) and (50, 50) ctx.beginPath(); ctx.moveTo(50, 50); ctx.lineTo(50, 300); ctx.lineTo(200, 50); ctx.lineTo(50, 50); ctx.stroke(); ctx.beginPath(); ctx.moveTo(200, 50); ctx.lineTo(200,300); ctx.lineTo(50, 300); ctx.closePath(); ctx.fill();
How the Canvas Works? • stroke() strokes the lastly created path with the given strokeColor(default is black, #000000) ctx.beginPath(); ctx.moveTo(50, 50); ctx.lineTo(50, 300); ctx.lineTo(200, 50); ctx.lineTo(50, 50); ctx.stroke(); ctx.beginPath(); ctx.moveTo(200, 50); ctx.lineTo(200,300); ctx.lineTo(50, 300); ctx.closePath(); ctx.fill();
How the Canvas Works? • canvas.beginPath() tells the Canvas that a new path is started ctx.beginPath(); ctx.moveTo(50, 50); ctx.lineTo(50, 300); ctx.lineTo(200, 50); ctx.lineTo(50, 50); ctx.stroke(); ctx.beginPath(); ctx.moveTo(200, 50); ctx.lineTo(200,300); ctx.lineTo(50, 300); ctx.closePath(); ctx.fill();
How the Canvas Works? • moveTo(200, 50) moves the canvas marker to position (200, 50), relatively to the top left corner ctx.beginPath(); ctx.moveTo(50, 50); ctx.lineTo(50, 300); ctx.lineTo(200, 50); ctx.lineTo(50, 50); ctx.stroke(); ctx.beginPath(); ctx.moveTo(200, 50); ctx.lineTo(200,300); ctx.lineTo(50, 300); ctx.closePath(); ctx.fill();
How the Canvas Works? • lineTo(200, 300) marks a straight line between dots with coordinates (200, 50) and (200, 300) ctx.beginPath(); ctx.moveTo(50, 50); ctx.lineTo(50, 300); ctx.lineTo(200, 50); ctx.lineTo(50, 50); ctx.stroke(); ctx.beginPath(); ctx.moveTo(200, 50); ctx.lineTo(200,300); ctx.lineTo(50, 300); ctx.closePath(); ctx.fill();
How the Canvas Works? • lineTo(50, 300) marks a straight line between dots with coordinates (200, 300) and (50, 300) ctx.beginPath(); ctx.moveTo(50, 50); ctx.lineTo(50, 300); ctx.lineTo(200, 50); ctx.lineTo(50, 50); ctx.stroke(); ctx.beginPath(); ctx.moveTo(200, 50); ctx.lineTo(200,300); ctx.lineTo(50, 300); ctx.closePath(); ctx.fill();
How the Canvas Works? • closePath() connects the first and the last dots from the path ctx.beginPath(); ctx.moveTo(50, 50); ctx.lineTo(50, 300); ctx.lineTo(200, 50); ctx.lineTo(50, 50); ctx.stroke(); ctx.beginPath(); ctx.moveTo(200, 50); ctx.lineTo(200,300); ctx.lineTo(50, 300); ctx.closePath(); ctx.fill();
How the Canvas Works? • fill() fills the lastly created path with the given fillColor (by default black, #000000) ctx.beginPath(); ctx.moveTo(50, 50); ctx.lineTo(50, 300); ctx.lineTo(200, 50); ctx.lineTo(50, 50); ctx.stroke(); ctx.beginPath(); ctx.moveTo(200, 50); ctx.lineTo(200,300); ctx.lineTo(50, 300); ctx.closePath(); ctx.fill();
Drawing Ellipses • The Canvas has a built-in methods for drawing ellipses • arc(x, y, radius, from, to, counterclockwise) • Draws a circle with center at (x, y) from position "from" to position "to" • Positions in ellipses are described using radians (degrees) The formula is: radians = degrees * PI/180 0 degrees == 0 radians 90 degress == PI/2 radians 180 degrees == PI radiauns 270 degrees == 3*PI/2 radians 360 degrees == 2*PI radians
Drawing Ellipses (2) 3*PI/2radians 270degrees 180degrees 0 (360) degrees PIradians 0 (2*PI) radians 90degrees PI/2radians
Drawing Ellipses: Example • To draw ellipses, a Path must be started: ctx.beginPath(); • Draw a full circle //clockwise ctx.arc(x, y, r, 0, 2*Math.PI); //counter clockwise ctx.arc(x, y, r, 2*Math.PI, 0, true); • Draw a segment of an ellipse //The smaller part (clockwise) ctx.arc(x, y, r, Math.PI/2, 2*Math.PI); //the bigger part (counterclockwise) ctx.arc(x, y, r, Math.PI/2, 2*Math.PI, true);
Drawing Ellipses and Segments Live Demo
Drawing Circular Sectors • A circular sector is the portion of a circle enclosed by two radiuses • The Canvas has no built-in methods for creating circular sectors • Yet, the Canvas supports paths • A circle sector can be done by creating a sector and then a line to the center of the circle
Drawing Circular Sectors: Example • context.closePath() connects the first and the last dots from the Path function drawSector(x, y, r, from, to, isCounterClockwise) { ctx.beginPath(); ctx.arc(x, y, r, from, to, isCounterClockwise); ctx.lineTo(x, y); ctx.closePath(); ctx.stroke(); }
Drawing Circular Sectors Live Demo
Drawing Curves with The Canvas • The Canvas supports two types of curves: • Quadratic curves • A simple curve drawn based on a control point • Bezier curves • A more complex curve based on two control points • Both quadratic and Bezier curves are done using a path
Quadratic Curves • Quadratic curves are basic curves • Using two context points and a control point • The first is the last point from the path (sx, sy) • The second is the one from the curve (cx, cy) • context.quadraticCurve(cx, cy, ex, ey)
Quadratic Curves Live Demo
Bezier Curves • Bezier curves are like quadratic curves, but with two context and two control points • context.bezierCurveTo(ex, ey, cx1, cy1, cx2, cy2)
Bezier Curves Live Demo
Canvas Styles • The canvas supports all kinds of styles • Styles for fill and stroke • Can be either a solid color or pattern • Styles for types of stroke • Dashed or solid • Done using kind of workaround
Canvas Styles Live Demo
Canvas Transformations • The Canvas can do transformations • i.e. it can be rotated, scaled or transformed • context.scale(dx, dy) – all coordinates and points are scaled • fillRect(X, X, W, H) will draw a rectangle • At position (dx * X, dy * Y) • With width (dx* W) and height (dy* H) • context.rotate(D) – all drawing is rotated with angle D degrees
Transformations Live Demo