Linkages between Trade, Development & Poverty Reduction
Linkages between Trade, Development & Poverty Reduction. Prashmita Ghosh N C Pahariya CUTS CITEE. Structure of the presentation. Theory behind TDP Why campaign kit? Indian economy highlights Agriculture Manufacturing Services Employment and poverty figures Conclusion.

Linkages between Trade, Development & Poverty Reduction
E N D
Presentation Transcript
Linkages between Trade, Development & Poverty Reduction Prashmita Ghosh N C Pahariya CUTS CITEE
Structure of the presentation • Theory behind TDP • Why campaign kit? • Indian economy highlights • Agriculture • Manufacturing • Services • Employment and poverty figures • Conclusion
About the project • International trade involves exchange of goods and services • Trade takes place when there is surplus production of goods and services • Growth rate increases with increase in international trade • Increased economic development leads to poverty reduction • Lack of empirical evidence of T-D-P linkage
Why Campaign kit • National advocacy tool • To provide more information about T-D-P linkage • To clear some conceptions on trade liberalisation vis-à-vis globalisation • Directed at stakeholders
Indian Economic Performance Source: India Development Report 2004-05
Agriculture • Mainstay of around 60 percent of population • Share of agricultural trade in GDP increased from 16 % (90’s) to 20% (99-00) • Majority of farmers have small, fragmented landholdings and practice subsistence farming • Agriculture still a part of the unorganised sector • Stagnation of employment in agriculture • Share of agri. in total employment : 60 %(93-94), 57 %(99-00) (Raghbendra Jha)
Problems Small, fragmented land holdings Lack of extension services Middlemen, trader community Poor warehousing, storage Irrigation issue Price fluctuation Recommendations Focus on land reforms Network of extension services with private participation This remains a difficult task; farmers awareness Expansion of storage facilities with private participation Efficient use of existing irrigation facilities, efficient use of groundwater, water user charges MSP, Government procurement, Commodity future market regulation, strengthening PDS Agriculture (contd.)
Industry • Growth rates were high just after reforms; but fell sharply in 2001-02 though picked up subsequently • Growth driven by manufacturing and construction sector • Merchandise exports growing at more than 20 % since 2002-03 • Major exports- textiles, gems, engineering goods, petroleum products, chemicals etc. • Current growth rate of manufacturing sector not sufficient for poverty alleviation
Industry (contd.) • Develop comparative advantage in low-value added manufacturing goods production; generate employment • Effect of indirect taxes, higher cost of utilities-power, transport, cost of finance • Industrial growth imperative to absorb surplus rural unskilled, uneducated, semi-literate labour
Services • High Indian economic growth driven by services industry • IT, ITES, Financial and allied services growth has been impressive; White collared jobs; Increased labour productivity • Retail, constructions, road transport service employs around 36 % of service sector labour force • Retail, construction-largely informal sector; employing low skilled labour
Services –some findings • Share of software, financial services increased in export basket • Share of travel and transport service has decreased • IT, Financial sectors have been opened up while retail and other sectors have not been exposed to sufficient domestic and foreign competition • Services sector growth concentrated in pockets around urban centres- increasing regional inequality
Employment Source: Raghbendra Jha(2005)
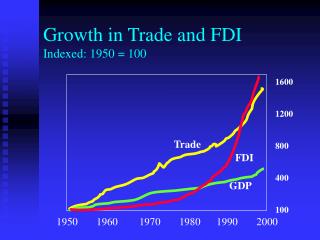
Trade Openness for India Source:World Development Indicators
Poverty Figures • *Poverty projection for 2007 • Source:Tenth Five Year Plan, Planning Commission, Government of India
Conclusion • Post reforms significant acceleration in growth rate • Growth is services driven- leading to lopsided growth • For all inclusive growth, agricultural, infrastructure, reforms are a must • Provision of basic services- access to education, water, food, shelter,clothing to the deprived , backward community • Above will then ensure trickling down of benefits of growth to all