Download
1 / 19
190 likes | 293 Views
Explore the CMB fluctuations at high-ℓ with CBI data, analyzing primary CMB fluctuations and secondary anisotropies. Discover the sensitivity to σ8 and potential sources of excess signal. Stay informed on the latest observations and upcoming CBI2 enhancements.

E N D
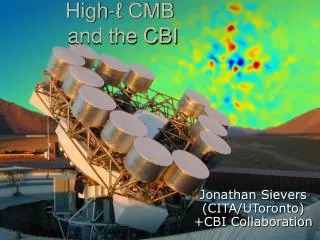
High-ℓ CMB and the CBI Jonathan Sievers (CITA/UToronto) +CBI Collaboration
CMB at High-ℓ • Primary CMB fluctuations low past ℓ~2000 • Signal expected to arise from secondary anisotropies – SZ galaxy clusters, point sources… • High power level seen in CBI (30 GHz, ℓ~2000), BIMA (30 GHz, ℓ~6000). ACBAR (150 GHz, ℓ~2000) sees level consistent with CBI if due to SZ (but also consistent with nothing?) • Observed level much(?) larger than expected, especially in light of WMAP3 low σ8. • SZ clusters expected to be dominant (non-point source) component, but models suggest level is very sensitive to σ8 (seventh power), preferably ~0.9-1, unlike 0.75 in WMAP3. What is the dominant source of signal at high-ℓ? We don’t know. Might even be interesting.
Current Best CBI Spectrum (vs. Old) Top panel – new spectrum! Will be published soon. Data on which current excess results based. Bottom – old best TT spectrum. Top – current best spectrum. For most of ell range, errors down by ~40%. CBI in compact config. in polarization, so little high-ell data. Highest bin only ~10% smaller. NB: two binnings shown. Red/blue points *not* independent.
Current CBI+BIMA PS Fit CMB+Excess model to CBI data (using raw data, not a fit to the power spectrum). Red curve SPH simulation-based template (Bond et al.), blue curve analytic (Komatsu&Seljak, Spergel et al.). Red points latest CBI w/ finer binning. Black points latest BIMA. ACBAR green. Models extrapolated to BIMA points – not a fit. Differences between analytic/simulation templates of factor of 2, implies σ8 model uncertainty of 0.08-0.09. If CBI excess were due to unexpected source population, BIMA would see them. They don’t.
Actual σ8 From Chains Do full parameter analysis with all CMB (including latest CBI, WMAP3). Inferred σ8 for Bond et al. template is 1.00±0.1, for Komatsu & Seljak is 0.93±0.1. Komatsu & Seljak consistent with latest Chandra M-T relation (Vikhlinin et al.). Latest XMM M-T (Arnaud et al.) 50% higher than Chandra – σ8~0.85? Subha Majumdar working on prediction. Errors assume Gaussian noise in PS only. Doesn’t include errors from non-Gaussianity of clusters, uncertainty in faint source counts (~35% increase) M-T SCATTER??
Sources w/ GBT Uncertain faint source flux at 30 GHz important source of uncertainty. When done with GBT observations, will nearly double significance of current CBI excess. Observing NVSS sources in CBI fields in 2-prong strategy. First: veto survey to measure all sources to see which ones matter at 30 GHz (large majority don’t). Second: deep obs. of faint NVSS sources to measure Ka counts. Are startbursts synchotron or Free-Free at 30? Requires GBT receiver to be stable for ~minute. White = NVSS sources in CBI fields. Green = observed by GBT as part of veto survey. Increases by 50-100% CBI data.
Very, Very Preliminary Optical-CMB Bin up clusters, measure CMB power vs. cluster “size”. SZ should be negative. If excess due to SZ, clusters in optical should correspond to holes in CBI maps. Have CFHT of CBI deep fields. Don’t have masses yet from RCS guys – only significance. Verynoisy. Want mass to ~50%. (NB, only 2 clusters in highest bin, 5 in second-highest) Field galaxies should show positive correlation (some are radio sources). Explains low-significance positive correlation? Note - sources in low-significance clusters already corrected for statistically in spectrum.
This month: CBI2! • Upgrading CBI for better spectrum. • 0.9m --> 1.4m dishes • Ground Shield (eventually) • Measure the excess • Much better SZ sensitivity.
CBI2 Forecast – 1 Year on CMB Slightly more pessimistic forecast gives 8% error on current excess. Should be able to get GBT follow-up observations. Black = CMB Red= CMB+current excess Magenta=CBI now Blue=CBI2 Green=thermal noise in CBI2
Summary • Combined CBI dataset gives much better CMB power spectrum, modest improvement at highest ell. • CBI detects excess power at ℓ>2000 at 3σ. Will go to ~5σ (assuming level doesn’t change) with GBT data (most of which is in hand). • Working on CMB/Optical correlation, results should come soon. • CBI2 will do much better on high-ℓ excess. Important even with other expts. due to l-range, frequency. (new ACBAR will do same ℓ range at 150, SZA will do somewhat higher-ℓ.). • Observations w/ CBI2 start this month!
CBI (+ACBAR?+BIMA) Excess • SZ clusters should contribute to the CMB power spectrum in a frequency-dependent way. • Signal level very sensitive to σ8 – roughly σ87ΩM2. • CBI currently detects excess at 4.1σ (vs. primary CMB) in overall level, fold in uncertainty due to faint point source contributions, goes to 2.9σ. • Currently observing radio point sources with GBT. Gets us more data, plus better knowledge of faint sources (currently 50% uncertainty). • CBI excess wants σ8~1. • BIMA also detects power at a level consistent with CBI if SZ. ACBAR has suggestion of detection, consistent with CBI+BIMA (150 GHz gets ¼ power of 30 GHz) - but also pure CMB.
How to Proceed? • If excess is from clusters, should be optical-radio correlation. Signal clear since clusters are negative in radio, unlike everything else in the sky. We have obtained CFHT images of CBI deep fields, doing correlation now. • Better source observations. 30 GHz faint source counts uncertain at ~50%. Leads to 25% uncertainty in excess level. GBT 30 GHz system working – we are observing faint sources in NVSS to nail down 1.4-30 spectral index distribution. • Look at clusters in more detail. CCCP (PI Henk Hoekstra) a program to do weak lensing of ~50 X-Ray bright clusters. CBI will get SZ of ~20 – will help with prediction of SZ amplitude. • And, of course, BETTER DATA! CBI being upgraded – 1.4m dishes being installed as we speak. CBI2 will be 5-20 times as efficient at excess/cluster observations as original CBI. Should have much better spectrum in a year.
Weak Lensing vs. SZ/X-Ray Masses (~10 total nights observing time on CBI2) Simple CBI2 forecast. Assume 130 uK error (differencing – worst case) or 80 uK (no differencing) errors. Fold in errors on X-Ray temp., see what errors on mass come out. Does not include shape uncertainties, point sources… Assumes same shape for everybody. (noise added vertically, but not horizontally)
Fit isothermal-β, fixing shape parameters from X-Ray. Get same model SZ decrement (10%) as OVRO, which is sensitive to ~10 times smaller scales. So for this case, isothermal-β a pretty good fit. Some Clusters Already Have observed ~15 z<0.1 clusters with CBI, of order 5 of CCCP sample. Image of 1 night on A2163.
CBI 2000+2001, WMAP, ACBAR, BIMA • Readhead et al. ApJ, 609, 498 (2004) s8 = .85 +- .05 CMBall+LSS SZE Secondary CMB Primary .82 +- .11 ~ s87 • Kuo et al. (2005, in prep) +Boom03; Acbar05: very nice TT, Oct05. parameters & new excess analysis as SZ
What I Still Did Last Night Split vs. redshift. SZ stronger at higher z? Maybe just a selection effect. Need to get better estimates of cluster masses…
What I Did This Morning New spectrum with GBT non-detections subtracted (not projected), noise term added. Errors improve by ~15%. Should get another 10-15% better when all of the sources are measured. Absolutely critical: measurement of faint (~1 mJy) 1.4 GHz sources. They are a different population, may have different 30 GHz properties. Uncertainty in excess evenly split between spectrum/source terms.
Can Tune Obs. Plan after 1 Month Optimal observing strategy depends on signal level. After 1-month, should have a much better idea of level Will be able tune obs. plan during the run, which is nice.
The Cosmic Background Imager (Currently strongest detection of high-ℓ power) • 13 90-cm Cassegrain antennas • 78 baselines • 6-meter platform • Baselines 1m – 5.51m • 10 1 GHz channels 26-36 GHz • HEMT amplifiers (NRAO) • Cryogenic 6K, Tsys 25 K • Single polarization (R or L) • Polarizers from U. Chicago • Analog correlators • 780 complex correlators • Field-of-view 44 arcmin • Image noise 4 mJy/bm 900s • Resolution 4.5 – 10 arcmin