Download
1 / 37
370 likes | 391 Views
Understand the impact of decentralization through monitoring and evaluation. Learn about indicators, types of evaluation, and the importance of comparison groups. Ensure your data is reliable and your indicators are measurable for effective decision-making.

E N D
Monitoring, Evaluation, and Impact Evaluation for Decentralization Markus Goldstein PRMPR
Outline • Monitoring • Types of evaluation • Why do impact evaluation • Why we need a comparison group • Methods for constructing the comparison group • Resources
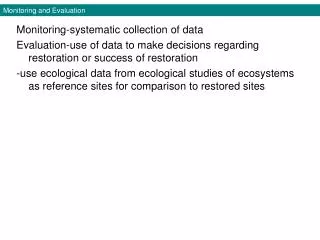
Monitoring • It’s about: • choosing meaningful indicators • that will measure progress towards a defined objective • within a system that will provide timely and accurate data • and a system that will use these data to adjust implementation
Indicators: What types? Indicators can be broadly classified into four categories: • Input: Input indicators track all the financial and physical resources used for an intervention. • Output: Output indicators cover all the goods and services generated by the use of the inputs. These measure the supply of goods and services provided to individuals. Outputs typically are fully under the control of the agency that provides them.
Indicators: What types? • Outcome: Outcome indicators measure the level of access to public services, use of these services, and the level of satisfaction of users. Unlike outputs, outcomes typically depend on factors beyond the control of the implementing agency (such as the behavior of individuals or other demand-side factors). • Impact: Impact indicators measure the ultimate effect of an intervention on a key dimension of the living standards of individuals – such as freedom from hunger, literacy, good health, empowerment, and security.
Effect on living standards IMPACT - better service impacts (e.g. literacy, U5MR) - increase in participation, happiness Access, usage and satisfaction of users OUTCOMES - use of local gov’t services - local gov’t budgets align with community prefs Goods and services generated OUTPUTS - more local gov’t service delivered - trained local gov’t officials Financial and physical resources INPUTS - budget support for local service delivery - training for local gov’t Indicators: What types?
Indicators: What qualities? • Be direct, unambiguous measure of progress (for instance: immunization coverage is less ambiguous than household expenditure on health) • Vary across group, areas, and over time (for instance: child malnutrition is more likely to vary quickly over time than life expectancy) • Have direct link with interventions (for instance: vehicle operating cost depends on road quality but also on many other factors, such as international petrol prices. It is therefore not a good indicator for progress in roads sector)
Indicators: What qualities? • Be relevant for policy making (for instance: use indicators at the right level of disaggregation, such as at the rayon level if expenditures are managed and executed at the rayon level. Use indicators that reflect the objectives) • Consistent with decision-making cycle (for instance: use indicators at intervals which match the decision making process, prepare indicators in time for budget discussions) • Not easily manipulated or blown off course by unrelated developments (for instance: some indicators can be very sensitive to external or exogenous factors. Others can be more likely manipulated: where there is self-reporting, or where incentive structures are such that one might be tempted to under or over-estimate the result).
Indicators: What qualities? • Easy to measure and not too costly to measure (for instance: number of deaths easily recorded, while number of cases of specific diseases sometimes harder to track accurately) • Easy to understand (for instance: poverty incidence is easier to understand and to communicate than poverty depth) • Reliable (for instance: scientific, objective indicators are more reliable than indicators which depend on the interpretation of the user. This is related to the above discussion on “manipulation”)
Indicators: What qualities? But more than anything else…. • Consistent with data available and the data collection capacity to ensure that indicators will be measurable at the times and level selected. In line with the planned calendar of data collection • Few but good ones, well chosen and measurable
Evaluation: 3 quick types • Participatory impact evaluation – analysis based on participatory methods among beneficiaries • Theory based/program logic evaluation – basically tracing the log frame throughout, using a range of techniques for measurement • Impact evaluation
Impact evaluation • Many names (e.g. Rossi et al call this impact assessment) so need to know the concept. • Impact is the difference between outcomes with the program and without it • The goal of impact evaluation is to measure this difference in a way that can attribute the difference to the program, and only the program
Why it matters • We want to know if the program had an impact and the average size of that impact • Understand if policies work • Justification for program (big $$) • Scale up or not – did it work? • Meta-analyses – learning from others • (with cost data) understand the net benefits of the program • Understand the distribution of gains and losses
What we need The difference in outcomes with the program versus without the program – for the same unit of analysis (e.g. individual) • Problem: individuals only have one existence • Hence, we have a problem of a missing counter-factual, a problem of missing data
Thinking about the counterfactual • Why not compare individuals before and after (the reflexive)? • The rest of the world moves on and you are not sure what was caused by the program and what by the rest of the world • We need a control/comparison group that will allow us to attribute any change in the “treatment” group to the program (causality)
comparison group issues • Two central problems: • Programs are targeted Program areas will differ in observable and unobservable ways precisely because the program intended this • Individual participation is (usually) voluntary • Participants will differ from non-participants in observable and unobservable ways • Hence, a comparison of participants and an arbitrary group of non-participants can lead to heavily biased results
Example: providing fertilizer to farmers • The intervention: provide fertilizer to farmers in a poor region of a country (call it region A) • Program targets poor areas • Farmers have to enroll at the local extension office to receive the fertilizer • Starts in 2002, ends in 2004, we have data on yields for farmers in the poor region and another region (region B) for both years • We observe that the farmers we provide fertilizer to have a decrease in yields from 2002 to 2004
Did the program not work? • Further study reveals there was a national drought, and everyone’s yields went down (failure of the reflexive comparison) • We compare the farmers in the program region to those in another region. We find that our “treatment” farmers have a larger decline than those in region B. Did the program have a negative impact? • Not necessarily (program placement) • Farmers in region B have better quality soil (unobservable) • Farmers in the other region have more irrigation, which is key in this drought year (observable)
OK, so let’s compare the farmers in region A • We compare “treatment” farmers with their neighbors. We think the soil is roughly the same. • Let’s say we observe that treatment farmers’ yields decline by less than comparison farmers. Did the program work? • Not necessarily. Farmers who went to register with the program may have more ability, and thus could manage the drought better than their neighbors, but the fertilizer was irrelevant. (individual unobservables) • Let’s say we observe no difference between the two groups. Did the program not work? • Not necessarily. What little rain there was caused the fertilizer to run off onto the neighbors’ fields. (spillover/contamination)
The comparison group • In the end, with these naïve comparisons, we cannot tell if the program had an impact We need a comparison group that is as identical in observable and unobservable dimensions as possible, to those receiving the program, and a comparison group that will not receive spillover benefits.
How to construct a comparison group – building the counterfactual • Randomization • Matching • Difference-in-Difference • Instrumental variables • Regression discontinuity
1. Randomization • Individuals/communities/firms are randomly assigned into participation • Counterfactual: randomized-out group • Advantages: • Often addressed to as the “gold standard”: by design: selection bias is zero on average and mean impact is revealed • Perceived as a fair process of allocation with limited resources • Disadvantages: • Ethical issues, political constraints • Internal validity (exogeneity): people might not comply with the assignment (selective non-compliance) • Unable to estimate entry effect • External validity (generalizability): usually run controlled experiment on a pilot, small scale. Difficult to extrapolate the results to a larger population.
Randomization & decentralization • Randomize the roll out of reforms… • Political issues • Implementation issues • Randomize phase in (have to work fast) • Randomize sub-components: • e.g. Randomize TA, or the phase-in of TA • Randomize different packages (e.g. some units get TA and computers, some units get only TA)…but this answers a different question • Randomize who rules…India panchayats
2. Matching • Match participants with non-participants from a larger survey • Counterfactual: matched comparison group • Each program participant is paired with one or more non-participant that are similar based on observable characteristics • Assumes that, conditional on the set of observables, there is no selection bias based on unobserved heterogeneity • When the set of variables to match is large, often match on a summary statistics: the probability of participation as a function of the observables (the propensity score)
2. Matching • Advantages: • Does not require randomization, nor baseline (pre-intervention data) • Disadvantages: • Strong identification assumptions • Requires very good quality data: need to control for all factors that influence program placement • Requires significantly large sample size to generate comparison group
Matching and decentralization • Using statistical techniques, we match a group of non-participating local government units with participating units using as many observable variables as possible that predict participation but are not affected by the intervention (e.g. demographics, distance to regional capital, etc). • Pipeline matching – use roll out to compare neighboring communities (danger of spillovers) • Requires a reform/intervention with a significant number of “units” • If we can alleviate concerns on unobservables has significant potential
3. Difference-in-difference • Observations over time: compare observed changes in the outcomes for a sample of participants and non-participants • Identification assumption: the selection bias is time-invariant (‘parallel trends’ in the absence of the program) • Counter-factual: changes over time for the non-participants Constraint: Requires at least two cross-sections of data, pre-program and post-program on participants and non-participants • Need to think about the evaluation ex-ante, before the program • Can be in principle combined with matching to adjust for pre-treatment differences that affect the growth rate
Implementing differences in differences in decentralization… • Some arbitrary comparison group • Matched diff in diff • Randomized diff in diff • These are in order of more problems less problems, think about this as we look at this graphically
As long as the bias is additive and time-invariant, diff-in-diff will work ….
4. Instrumental Variables • Identify variables that affects participation in the program, but not outcomes conditional on participation (exclusion restriction) • Counterfactual: The causal effect is identified out of the exogenous variation of the instrument • Advantages: • Does not require the exogeneity assumption of matching • Disadvantages: • The estimated effect is local: IV identifies the effect of the program only for the sub-population of those induced to take-up the program by the instrument • Therefore different instruments identify different parameters. End up with different magnitudes of the estimated effects • Validity of the instrument can be questioned, cannot be tested.
IV and Decentralization • Random encouragement…If we have a program where local government has to enroll, we randomly allocate encouragement – this is “exogenous” and can serve as an instrument • Generally tough – requires creativity…
5.Regression discontinuity design • Exploit the rule generating assignment into a program given to individuals only above a given threshold – Assume that discontinuity in participation but not in counterfactual outcomes • Counterfactual: individuals just below the cut-off who did not participate • Advantages: • Identification built in the program design • Delivers marginal gains from the program around the eligibility cut-off point. Important for program expansion • Disadvantages: • Threshold has to be applied in practice, and individuals should not be able manipulate the score used in the program to become eligible.
RDD in decentralization • Need a program with a specific rule as to which units are eligible • e.g. only local government units below a certain poverty threshold get power over a certain set of expenditures • Need lots of units around the cut off
Resources for doing impact evaluations • Website: type impactevaluation into your browser • Range of training materials • Database of completed evaluations • Roster of consultants • Clinics - on demand, customized support • Training