Download
1 / 10
100 likes | 336 Views
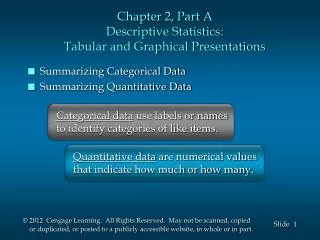
Chapter 3: Graphical Ways of Describing Data. Graphs for Categorical Data. Bar Charts Comparative Bar Charts Segmented Bar Charts Pie Charts. Use frequency or relative frequency. Describing: Look for most popular, rarest, comparison, trends. Categorical Interpretation.

E N D
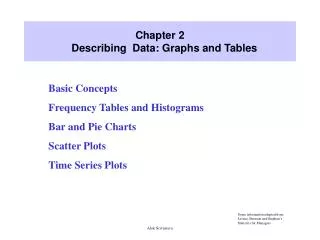
Graphs for Categorical Data • Bar Charts • Comparative Bar Charts • Segmented Bar Charts • Pie Charts Use frequency or relative frequency Describing: Look for most popular, rarest, comparison, trends
Categorical Interpretation • Bad: X was the most popular, followed by Y, then Z and finally W • Good: The most popular by far was X with more than all the others combined; as ____ increased, there was a trend of _____
Stem-and-Leaf Plots • Split Stems • Back-to-back plots • Guidelines: • If more than one digit in leaf, separate observations with commas • Always give key • Truncate Interpretation: C/Sh/Sp/U
Histograms • Use frequency or relative frequency • Discrete or continuous numeric variables
Histograms - Density • Uneven class intervals use density • Density = (relative frequency) / (class width) • Density is the y-axis label
Shape • Skew is always where the tail is direction that the mean is pulled in • Right / left skew • Positive / negative skew • Think of as a number line • Normal • Other shape terms
Scatterplot • Bivariate, numeric data sets • Creation • Interpretation – FUDS • Form – linear, nonlinear, constant, etc. • Unusual – outliers, influentials • Direction – negative, positive • Strength – strong, moderate, weak
Cumulative Relative Frequency Plot • Creation • Finding percentiles
Time Series Plot • Interpretation – look for trends and cycles