Download

1 / 52
520 likes | 726 Views
Satellites, Weather, and Climate Module 19:. Characteristics of Northeast Winter Snow Storms. Dr. Jay Shafer Dec 8, 2011 Lyndon State College Jason.Shafer@lyndonstate.edu. Outline. Large scale structure of Northeast Snow Storms Surface pressure patterns Moisture patterns

E N D
Satellites, Weather, and Climate Module 19: Characteristics of Northeast Winter Snow Storms Dr. Jay Shafer Dec 8, 2011 Lyndon State College Jason.Shafer@lyndonstate.edu
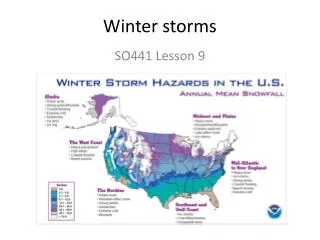
Outline • Large scale structure of Northeast Snow Storms • Surface pressure patterns • Moisture patterns • Frontal patterns • Forecasting storms: tools meteorologists used to predict today’s snow storm
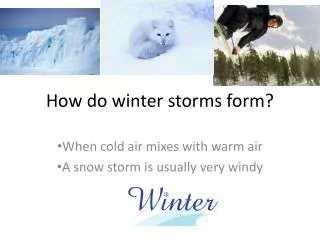
Learning Outcomes • Improve understanding of the typical lifecycle of mid-latitude cyclones • Improve understanding of the structure of Nor’easters and how they produce heavy snowfall • Develop a basic understanding of how weather forecast models can be used to predict these events
30 Stations used in our study Northeast Snow Storm Project • Identified top 30 snow storms 1977-2007 using • area-averaged weighing of daily snow amounts Results available online: http://apollo.lsc.vsc.edu/projects/snowstorm/
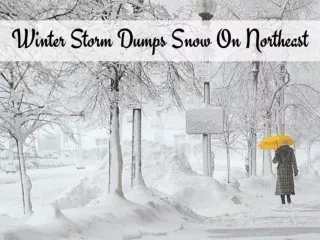
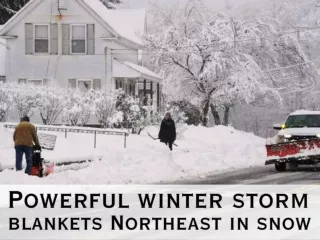
Surface Pressure Patterns Valentine’s Day Blizzard, February 14 2007 Photo credit: Alexander Jacques
Surface low pressure tracks for major NE Snow Storms Low Pressure End Areas Low Pressure Origin Areas Storm centers usually track from southwest to northeast, and they have a diverse origin location, but there is confluence in tracks in the Northeast. Note that all storms, except one, have tracks near the coast or at the coast, and not inland.
Storm Development “Cyclogenesis” Climatology Cyclones, or areas of low pressure, are favored to form along the east coast, and downstream, or to the lee of the major mountain barriers. Roebber 1984, MWR
Principle January Cyclone Tracks Track A Track C Track B Three principle mean tracks; two downstream of the Rocky Mountains, and one coastal corridor track. Note that, on average, most east coast winter cyclones move out to sea before they have high impacts on the northeast US. Zishka and Smith, 1980, MWR
Why is the east coast favored for cyclone or low pressure formation? Cold Continental Air Masses Juxtaposition of cold air masses and warm temperatures related to Ocean temperatures creates a strong temperature gradient or “frontal zone” Gulf Stream Current This creates baroclinic instability, which is an instability resulting from a strong temperature gradient; Mother Nature does not like strong temperature gradients, so a midlatitude cyclone develops to even out this gradient and bring warm air north and cold air south.
Average Pressure and Observed 3-HR Precipitation: Hour -18 Note the presence of a strong area of high pressure in place ahead of the storm; this provides cold air, increases moisture flux into the storm, and intensifies fronts. H L Most major interior NE snow storms begin as a coastal track “C” and then intensify as they move up the coast, but a good number have a pre-existing area of low pressure over the Ohio Valley and then reform off the coast. Precipitation, shaded (inches)
Average Pressure and Observed 3-HR Precipitation: Hour -12 Low consolidates as it approaches the coast, and precipitation is falling well to the northeast of the low center. H L
Average Pressure and Observed 3-HR Precipitation: Hour -06 H Low is intensifying, or undergoing cyclogenesis, with a composite value of ~1000mb; note that flow is strongly easterly at the sfc L
Average Pressure and Observed 3-HR Precipitation: Hour 0 H L
Average Pressure and Observed 3-HR Precipitation: Hour +06 H Composite low is now ~992mb and wind has shifted more Northeasterly -> this is why such storms are called, “Nor’easters” L Airflow is spinning counterclockwise or “cyclonically” around The low pressure, as it always does in the Northern Hemisphere. H
Average Pressure and Observed 3-HR Precipitation: Hour +12 Storm is still intensifying as it moves away from region; The most vigorous storms are in their early stages to middle age, but not “old” and winding down. L H
Average Pressure and Precipitable Water (Inches) Hour: -18 H Moisture Plume or Atmospheric River Deep moisture plume ahead of the low pressure is present; this acts to enhance available moisture into the storm system, creating more precipitation and greater intensification via latent heat release. Up to half of the intensification of these storms can be attributed to heating of the column via latent heating, which is release when water vapor condenses into clouds. L Precipitable water, shaded (inches)
Average Pressure and Precipitable Water (Inches) Hour: 0 H Moisture Plume or Atmospheric River L Warm Moist Conveyor Belt
Mid Latitude Cyclone Lifecycle Mid-latitude cyclones evolve through different phases: Phase I: East-west stationary frontal zone with warm air south and cold air north strong temperature gradient is present Phase II: A kink develops on the isotherms (lines of constant temperature) as warm and cold fronts develop and move. Phase III: Wave on the isotherms amplifies and cold front advances faster than warm front; cyclone is nearing maturity Phase IV: Occlusion develops as cold front catches up with warm front; this process does not always occur with every cyclone; ridge of warm temperatures extends back toward the low center; storm is weakening L cold cold cold warm warm sector warm warm Isotherms: Lines of Constant Temperature
Average Pressure and 850-MB Temperature Hour: -18 H cold cold L Note the wave shape of the isotherms, and position of the surface low near its inflection. warm 850mb Temp (deg C), shaded
Average Pressure and 850-MB Temperature Hour: -06 H L Warm front Similarities to Phase II mid-latitude cyclone as warm and cold fronts develop more curvature Cold front
Average Pressure and 850-MB Temperature Hour: +12 Warm front L cold sector warm sector Cold front Similarities to Phase III mid-latitude cyclone as temperature wave amplifies further
An upper-level disturbance is needed to perturb the Low-level temperature gradient to produce a cyclone; these are usually coherent features traceable days upstream You can think of the jet stream as producing these features. Kocin and Uccellini 2004
Vertical Structure Ahrens 2006
GFS Model Forecast: 39 Hour Forecast Valid 4:00AM Thursday L Isobars (solid lines), 6-Hour Precipitation Shaded
NAM Model Forecast: 39 Hour Forecast Valid 4:00AM Thursday L Both models are similar in their position of the low, but the NAM Is a little slower in the progress on the surface low position. Isobars (solid lines), 6-Hour Precipitation Shaded
There was a lot of spread in the position/timing of the surface low, even with a 2-day forecast. This plot shows a position of the surface low pressure position for the different model versions.
Models trended more inland with the storm track leading up to the event The next four slides show the probability of accumulating precipitation valid at the SAME forecast time on 4:00 AM Thursday Probabilities in %
60 Hour Forecast Probabilities in %
54 Hour Forecast Probabilities in %
48 Hour Forecast Probabilities in %
42 Hour Forecast Note inland shift in probabilities. The trend is your friend. Probabilities in %
Activity • Plot the surface low position every 3 hrs over the last day for today’s storm • How did the track of the storm compare to other snow storms? • Annotate the surface low strength in (mb) to each low position • Was the surface low intensifying, decaying, or remaining the same strength as it passed the Northeast? • Compare frontal development to the typical midlatitude cyclone model • What stage or stages did today’s snow storm evolve through?