Download
1 / 12
120 likes | 148 Views
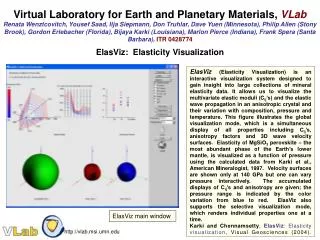
Development of an interactive system to visualize elastic constants and wave velocities of crystals under different conditions, supporting remote access and online data repository. Features personalized settings and sophisticated rendering techniques for comprehensive analysis.

E N D
A Visualization System For Mineral Elasticity Richard Perkins
Introduction • Objectives: • To continue development on the interactive elasticity visualization system • To interactively visualize elastic constants and wave velocities-direction data of crystals with different pressures, temperatures and compositional factors • To support remote visualization • Client-Server architecture approach • To support an online data repository
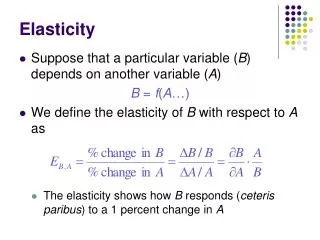
Definitions • Elasticity/Elastic • When a material is elastic it deforms under stress but return to its original state when the stress is removed • Elastic constants (Cij’s) • The relation between stress and strain as defined in Hooke’s Law • Used to define the elasticity of a crystal as a multivariate physical quantity • Wave velocity-direction data • Calculated from the elastic constants and wave propagation direction using Cristoffel’s equation • Produces three sets of wave velocities-direction data: a longitudinal wave parallel to the propagation direction and two shear waves perpendicular to the propagation direction • Anisotropic factors • Are used to compare the velocities of the different waves
Plots • Star plots and parallel plots • Used to directly represent the elastic constants • An-plot • Plots anisotropy factors for longitudinal and shear waves • Polygon-base surface rendering • Graphically represent the three waves (one longitudinal and two shear waves)
Polygon-based surface Rendering • How waves are rendered • Use an icosahedron in which each vertex on the surface represents a propagation direction • Recursively subdivide triangles into 4 triangle thereby increasing the number of vertexes • Use the wave velocity-direction data calculated from Cristoffel’s equation to figure out each velocity at each vertex (propagation direction) • Re-position the vertices in 3D space to represent the velocity-direction distribution.___
1st Degree 80 triangles 2nd Degree 320 triangles 3rd Degree 1280 triangles 4th Degree 5120 triangles
Velocity-direction Features • Features pertaining to wave velocity-direction rendering • Views • 3d velocity • XY/YZ/ZX plane • Frame • Solid/wire • Shading • Enables/Disabled/Scaled • Axis • Degree
Other Features • Personalized line color and thickness • Single and Multiple mode • Temperature and pressure • Zooming • Clear screen • Removal of data from screen • Data being visualized is selected in tree • Manipulation of star plot which include: • Changing axes • Removing axes • Rotating axes • … And many more
Conclusion • Our system allows us to visualize elastic constants and wave velocities as a function of pressure, temperature and composition • Our system visualizes the data through the use of star plots, parallel plots, an-plots, and polygon-based surface rendering
Future Prospects • Make remote application access more user friendly • Expand the database • Extend the visualization system to polycrystalline and multiphase composites • Make the visualization system more user interactive