ElasViz: Elasticity Visualization
Virtual Laboratory for Earth and Planetary Materials, VLab Renata Wenztcovitch, Yousef Saad, Ilja Siepmann, Don Truhlar, Dave Yuen (Minnesota), Philip Allen (Stony Brook), Gordon Erlebacher (Florida), Bijaya Karki (Louisiana), Marlon Pierce (Indiana), Frank Spera (Santa Barbara), ITR 0428774.

ElasViz: Elasticity Visualization
E N D
Presentation Transcript
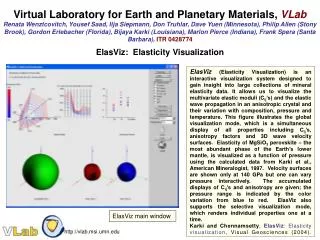
Virtual Laboratory for Earth and Planetary Materials, VLabRenata Wenztcovitch, Yousef Saad, Ilja Siepmann, Don Truhlar, Dave Yuen (Minnesota), Philip Allen (Stony Brook), Gordon Erlebacher (Florida), Bijaya Karki (Louisiana), Marlon Pierce (Indiana), Frank Spera (Santa Barbara),ITR 0428774 ElasViz: Elasticity Visualization ElasViz(Elasticity Visualization) is an interactive visualization system designed to gain insight into large collections of mineral elasticity data. It allows us to visualize the multivariate elastic moduli (Cij’s) and the elastic wave propagation in an anisotropic crystal and their variation with composition, pressure and temperature. This figure illustrates the global visualization mode, which is a simultaneous display of all properties including Cij’s, anisotropy factors and 3D wave velocity surfaces. Elasticity of MgSiO3 perovskite – the most abundant phase of the Earth’s lower mantle, is visualized as a function of pressure using the calculated data from Karki et al., American Mineralogist, 1997. Velocity surfaces are shown only at 140 GPa but one can vary pressure interactively. The accumulated displays of Cij’s and anisotropy are given; the pressure range is indicated by the color variation from blue to red. ElasViz also supports the selective visualization mode, which renders individual properties one at a time. Karki and Chennamsetty, ElasViz:Elasticity visualization, Visual Geosciences (2004). ElasViz main window http://vlab.msi.umn.edu
Virtual Laboratory for Earth and Planetary Materials, VLabRenata Wenztcovitch, Yousef Saad, Ilja Siepmann, Don Truhlar, Dave Yuen (Minnesota), Philip Allen (Stony Brook), Gordon Erlebacher (Florida), Bijaya Karki (Louisiana), Marlon Pierce (Indiana), Frank Spera (Santa Barbara),ITR 0428774 VLab Portals In support of VLab’s Grid middleware, we are building component-based portals that will simplify the complicated submission and code management problems involved in VLab research. Based on a core of standard Grid technology such as the Globus toolkit and the Java CoG kit, we are building advanced Web Services for workflow and job management. The VLab Web Portal serves as a client management environment to these service components. We build these portals out of standard components called “portlets”, following the model of the Open Grid Computing Environments (OGCE). Portlets allow entire user interface applications, such as components for submitting PWSCF and other QUANTUM ESPRESSO codes, to be bundled into a reusable, distributable component that may be easily installed in other portal systems. This allows us to share VLab-developed components with our international collaborators and vice versa. Marlon Pierce, Dan Kigelman, Mehmet Nacar, Gordon Erlebacher, Cesar R.S. da Silva, David Yuen, VLab Portals. We are also investigating reusable portal components at a finer grain than portlets. By extending Sun’s Java Server Faces to support VLab Grid service clients, we will be able to greatly simplify the process of designing portlets themselves from reusable components. This will also allow us to work closely with component designers from other, unrelated portal efforts through the OGCE. http://vlab.msi.umn.edu Screenshot of the prototype portal using OGCE in a uPortal container.
Virtual Laboratory for Earth and Planetary Materials, VLabRenata Wenztcovitch, Yousef Saad, Ilja Siepmann, Don Truhlar, Dave Yuen (Minnesota), Philip Allen (Stony Brook), Gordon Erlebacher (Florida), Bijaya Karki (Louisiana), Marlon Pierce (Indiana), Frank Spera (Santa Barbara),ITR 0428774, 0425059, 0427264, 0426601, 0426867, 0426757 VLab’s General Architecture VLab is a system aimed to allow geo-materials scientists to execute extensive workflows on top of distributed resources like databases or distributed computing nodes. It will also allow for monitoring executions and analyses of results. A crucial component is the VLab portal. It provides to the users the abstraction of a single system, while providing access to the underlying grid resources. It aggregates in a single site the interfaces of the several services used by the users to accomplish their workflows. It will also interface user transparent services like resource brokering and fault tolerance support. Pierce, M., Kigelman, D., Nacar, M., Erlebacher, G., da Silva, C. R. S., Yuen, D.,VLab Portals VLab’s general architecture. The portal (previous slide) interfaces the user with several services producing the consistent view of the numerous grid end resources (right) as a single system. http://vlab.msi.umn.edu
Virtual Laboratory for Earth and Planetary Materials, VLabRenata Wenztcovitch, Yousef Saad, Ilja Siepmann, Don Truhlar, Dave Yuen (Minnesota), Philip Allen (Stony Brook), Gordon Erlebacher (Florida), Bijaya Karki (Louisiana), Marlon Pierce (Indiana), Frank Spera (Santa Barbara),ITR 0428774, 0425059, 0427264, 0426601, 0426867, 0426757 VLab Undergraduate Internship Program - Summer 2005 Professor David A. Yuen, Department of Geology and Geophysics. Project Description: Interns associated with David Yuen are working on visualization projects. One consists of visualizing and analyzing large geophysical datasets on the Powerwall display device. Amira and Paraview are the visualization software packages being used. Another project consists in developing a Web-service for allowing visualization from Paraview software to be rendered and observed by remote users through the middleware NaradaBrokering. Students: (From left) Gretchen Beebe, Physics, Mathematics (Minor: Chemistry), Monica Christiansen, Aerospace Engineering, Benjamin J. Kadlec, Computer Engineering, Ekaterina Shukh, Computer Science, Shuo Wang (not shown), Computer Engineering. They are all University of Minnesota students. Professor Donald G. Truhlar, Department of Chemistry Project Description:This project is about modeling various water systems. It involves determining how well different methods do at modeling water systems with an OH radical, and possibly improving some existing method for this purpose. Student: Ian Haken Texas Academy of Mathematics and Science, major in Mathematics, Computer Science http://vlab.msi.umn.edu
Virtual Laboratory for Earth and Planetary Materials, VLabRenata Wenztcovitch, Yousef Saad, Ilja Siepmann, Don Truhlar, Dave Yuen (Minnesota), Philip Allen (Stony Brook), Gordon Erlebacher (Florida), Bijaya Karki (Louisiana), Marlon Pierce (Indiana), Frank Spera (Santa Barbara),ITR 0428774, 0425059, 0427264, 0426601, 0426867, 0426757 IT Meeting at CINECA, Bologna This meeting aimed at connecting the Italian QUANTUM ESPRESSO (QE) development team with the VLab IT team. The QE public software package for electronic structure and materials properties computations will be accessible by means of portals through the VLab system. Above:Stefano de Gironcoli (SISSA and Democritos) and Carlo Sbraccia (Princeton). Below: Carlo Cavazzoni (CINECA) and Stefano Baroni (SISSA and DEMOCRITOS) Left: Stefano Cozzini in the backgrond (Democritos), Cesar R. S. da Silva (VLab/MSI), Stefano de Gironcoli, Paolo Gianozzi (Pisa), Carlo Sbraccia, Andrea dal Corso looking back (Democritos and SISSA), and Stefano Baroni. Right: Second and first at Cesar’s left are Gordon Erlebacher (Florida) and Marlon Pierce (Indiana). First on the left is Cozzini. http://vlab.msi.umn.edu