Download
1 / 30
300 likes | 319 Views
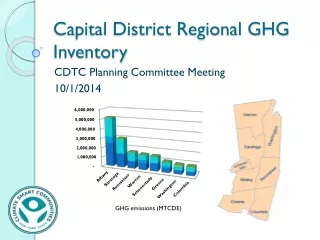
Capital District Regional GHG Inventory. CDTC Planning Committee Meeting 10/1/2014. GHG emissions (MTCDE). Agenda. Overview of the Regional GHG Inventory What is it and why was it done? Key findings- transportation and community form Using the inventory in your community

E N D
Capital District Regional GHG Inventory CDTC Planning Committee Meeting 10/1/2014 GHG emissions (MTCDE)
Agenda • Overview of the Regional GHG Inventory • What is it and why was it done? • Key findings- transportation and community form • Using the inventory in your community • Climate, sustainability, comprehensive planning • Getting $$: grant writing / resources development
What is it? • Comprehensive GHG inventory for the Capital District REDC • Supports local and regional planning • Baseline Year 2010 • Available at CDRPC website
Basic Purpose • Developed as a baseline and goal setting tool for Capital Region Regional Sustainability Plan • Provide support for other planning efforts: • Regional: e.g., CDTC New Visions RTP • Local: Helps CDRPC and CDTC members avoid the effort of developing ground-up GHG inventories themselves.
Main GHG Sources • Stationary Energy (Fossil Fuels) • Residential, Commercial, Industrial, Power Generation Sectors. • Direct fuel use and indirect emissions from electricity • Transportation Fuels • Gasoline, Diesel, Natural Gas, LPG • Sectors: Road, rail, air, marine, other non-road • Process and Fugitive Emissions • refrigerants, agriculture, industrial process- cement, paper, semiconductor manufacturing. • Waste Management • Landfills, waste-to-energy plants, and wastewater treatment
County GHGInventories • Appendix A • All eight REDC counties • Albany • Columbia • Greene • Saratoga • Schenectady • Rensselaer • Warren • Washington
CSC Community GHG Inventories Includes 160 community inventories with a 2010 baseline APPENDIX B
Data Sources • Utility data from National Grid, Central Hudson, NYSEG, and GIPA. • CDTC Provided detailed Vehicle-miles-traveled (VMT) data for all communities. • NYSDEC and EPA reports for industrial and large commercial point sources. • Used NYSDEC solid waste reports to estimate community waste generation. • Many other sources.
GHG Emissions and Energy • 15.8 Million Metrics Tons Carbon Dioxide Equivalent (MTCDE) • 14.7 MTCDE per capita • $4.5 billion spent on energy
Petroleum Costs Are Skyrocketing • Petroleum fuels are, by far, the greatest source of GHG emissions. • The Capital District spent $4.5 billion for energy ($4100 / person), paying 60% more than it did 10 years ago after adjusting for inflation. • Much of the increase was driven by rising petroleum fuel prices. • $2.9 billion purchased imported petroleum that takes money of our economy.
Per Household Energy Price Increase, by County (10 year increase)
GHG Emissions from Energy Used in the Home GHG Emissions from Energy Used for Transportation, by Household
Upstate NY Clean Electricity Mix Electric vehicles create less than half of emissions per mile because New York has clean electricity.
Local and Regional Planning • Climate Smart Communities • Pledge element 2: Set goals, inventory emissions, plan for climate action • Your inventory is already done. • Planning Updates • Climate Action Plans • Comprehensive Plan updates • Sustainability Plans • Energy Plans
Sustainability Metrics for Each Community • Vehicle Miles Traveled • Utility energy use by sector • Household Energy, GHG emissions • Fuels use, e.g., wood, oil, propane, etc. • Major industrial sources • Solid waste generation (tons)
Community GHG Profile • Understand your GHG sources. • Set goals and create a climate action plan. • Implement measures and track progress. City of Albany Town of Kinderhook Town of Fort Anne
Create a Local Energy Profile • Energy source, fossil vs renewable • Energy cost to community • Set goals to reduce petroleum and energy use. Community A Community B Petroleum Petroleum N. Gas
“Buy Local” Energy Targets Local Energy Imported Energy New York Electricity Electric Vehicle Policies Local Solar, Wind, Biomass Ground Source Heat New York Natural Gas Gasoline Diesel Fuel Oil Coal
Grant Development ($) • Sustainability is touching nearly all funding and policy tools like the Smart Growth Public Infrastructure Act • State Funding: NYSDOT, NYSDEC, EFC, NYSDOS, NYSERDA • Cleaner Greener Communities • Finance: Green Bank • Many others grants and pools of money • Proposals based on strategic goals and metrics present better.
Recap… • GHG inventories for Capital District counties and most municipalities within the CSC pilot regions. • Support available from the Climate Smart Communities program for making use of inventory products. • Ongoing development work needed in collaboration with CDTC • Report available at the CDRPC website.
Thank You. Jim Yienger Climate Action Associates LLC mr_jjy@climatetools.com