Download
1 / 12
120 likes | 210 Views
This study focuses on wave forcing from the lower atmosphere and seasonal density variations, utilizing an integrated model to analyze density variability and temperature corrections. Significant spectral peaks are identified, indicating potential planetary wave effects. The Whole Atmosphere Model (WAM) integrated with the Global Ionosphere-Plasmasphere (GIP) model is employed, incorporating various physics factors to forecast density changes globally. Validation against data from various sources confirms the model's accuracy in predicting tidal variability and density oscillations, showcasing its potential for understanding atmospheric dynamics on various timescales.

E N D
NADIR MURIIV. Wave forcing from the lower atmosphere IDEA/WAM model development and first results (R. Akmaev, F. Wu, H. Wang, and T. Fuller-Rowell) Seasonal density variations in NCAR TIE-GCM (S. Solomon and L. Qian)
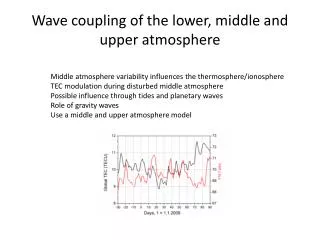
Motivation: density variability Temperature correction (dTc) to empirical J70 model from 4 satellite orbits in 2002 compared to solar and geomagnetic indices. Significant spectral peaks near 11, 14, and 19 days are a possible manifestation of PW effects. (Courtesy B. Bowman, 2006)
Whole Atmosphere Model (WAM) Global Ionosphere-Plasmasphere (GIP) Model Column Physics Plasma Physics Surface Physics WAM/GIP Interface Ui, Vi, & ni Ni, J, & Jp Spherical/Hybrid Coordinate System Magnetic Apex Flux-Tube Coordinate System U, V, & T O, O2, & N2 Neutral Dynamical Spectral Core Plasma Dynamics & Electrodynamics Coupled model of Integrated Dynamics through Earth’s Atmosphere (IDEA)
WAM = Extended GFS + Physics Operational Global Forecast System T382L64 (~ 0.30.3, ~ 0 – 62 km) Hydrology, surface exchange processes, ozone transport, radiation, cloud physics, etc. 4 forecasts daily Ensemble (14 members) forecast up to 16 days WAM 150 layers (~ 0 – 600 km) ρS/ρT ~ 1013 Variable composition thermodynamics Column + surface physics Timing: ~ 8 min/day on 32 nodes @ T62L150
Validation: DW1 T tide @ 100 km TIMED/SABER data (Forbes et al., 2008)
Validation: SW2 T tide @ 100 km TIMED/SABER data (Forbes et al., 2008)
Validation: DE3 T tide @ 116 km TIMED/SABER data (Forbes et al., 2008)
Validation: DE3 U tide @ 95 km UARS/HRDI&WINDII TIMED/TIDI UARS data (Forbes et al., 2003), TIMED data (Oberheide et al., 2006)
Tidal variability: T (m = 3) The presence of migrating and nonmigrating tides modulated at scales of several days in the lower thermosphere (E-layer dynamo) region is evident
Density variability: time series High-pass one-year WAM simulation shows residual variability of global mean density on short time scales
Density variability: wavelet spectrum Global mean density shows variability (events) on scales from daily to intraseasonal
Density variability: wavelet spectrum Density at 300 km Period (days) Day number Global mean density shows variability (events) on scales from daily to intraseasonal