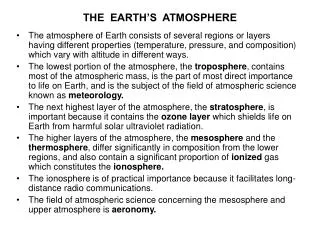
Download
1 / 13
130 likes | 265 Views
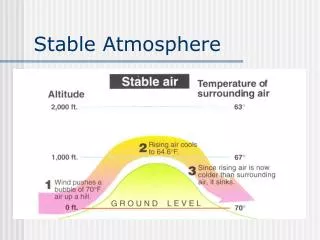
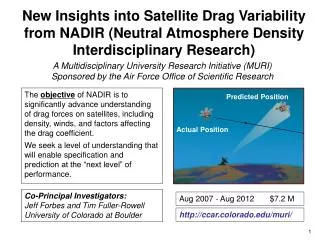
Predicted Position. Actual Position. New Insights into Satellite Drag Variability from NADIR (Neutral Atmosphere Density Interdisciplinary Research). A Multidisciplinary University Research Initiative (MURI) Sponsored by the Air Force Office of Scientific Research.

E N D
Predicted Position Actual Position New Insights into Satellite Drag Variability from NADIR (Neutral Atmosphere Density Interdisciplinary Research) A Multidisciplinary University Research Initiative (MURI) Sponsored by the Air Force Office of Scientific Research The objective of NADIR is to significantly advance understanding of drag forces on satellites, including density, winds, and factors affecting the drag coefficient. We seek a level of understanding that will enable specification and prediction at the “next level” of performance. Co-Principal Investigators:Jeff Forbes and Tim Fuller-Rowell University of Colorado at Boulder Aug 2007 - Aug 2012 $7.2 M http://ccar.colorado.edu/muri/
Focus Areas • Scales of Density Variability, Winds, and Drag Prediction • Internal Processes and Thermosphere-Ionosphere Coupling • Energy Partitioning at High Latitudes and Density Implications • Wave Forcing from the Lower Atmosphere • Forecasting Geomagnetic Activity • Forecasting Solar EUV/UV Radiation • Driver-Response Relationships • Satellite Drag in the Transition Region
Seventh Symposium on Space Weather • AMS Meeting, January 18, 2010 NADIR Participants • Collaborators • Jeffrey Anderson, NCAR • Eugene Avrett, Harvard-SAO • Christopher Bass, AFSPC • Bruce Bowman, AFSPC • Gary Bust, UTSA • Mihail Codrescu, SEC, NOAA • Doug Drob, NRL • Irene Gonzalez-Hernandez, NSO • Cheryl Huang, AFRL • Chin Lin, AFRL • Charles Lindsey, Co-RA • Frank Marcos, AFRL • Matthew McHarg, USAFA • Craig McLaughlin, U Kansas • Cliff Minter, NGA • Steve Nerem, CU • Andrew Nicholas, NRL • Jens Oberheide, U Wuppertal • Vic Pizzo, SEC, NOAA • Eric Quemaris, CNRS • Arthur Richmond, NCAR • Stan Solomon, NCAR • Thomas Woods, CU • Co-Investigators • Rashid Akmaev, • Brian Argrow, • George Born, • Geoff Crowley, • David Falconer, • Delores Knipp, USAFA • Juan Fontenla, • Tomoko Matsuo, • Dusan Odstrcil, • Joachim Raeder, • Jeff Thayer, Administration Sarah Melssen, CU DoD Oversight Kent Miller, AFOSR; Michelle Gaudreault, AFSPC; Robert McCoy, ONR
near side far side near side VI. Forecasting Solar EUV/UV Radiation, Juan Fontenla, Co-I HIGHLIGHT: Far-Side Imaging Phase-sensitive helioseismic holography (Lindsey, Braun et al.) L- radiation far-side back-scattering (Quemerais, Bertaux et al.) Active regions on the far side of the Sun can be detected due to the difference in travel time between going into and out of an active region. This phase sensitivity is observed in waves appearing on the surface one the near side of the Sun. Enhanced L- radiation from active regions on the far side of the Sun, resonantly back-scattered from H atoms in the inner heliosphere.
Diagonal line:Fit to bins with > 0.01 events/day (dashed line) Events/day No event Events/day Gauge of Free Magnetic Energy V. Forecasting Geomagnetic Activity, Dusan Odstrcil, Co-I HIGHLIGHT: Forecasting Solar Events Using Solar Magnetograms, David Falconer, Co-I Phase I: Utilize “free magnetic energy” (~twist x size) of active regions on the Sun as a predictor of CMEs, Flares and SEP events. Based on ~40,000 magnetograms from 1,300 Active regions (AR), 1996-2004, and NOAA’s flare, CME and Solar Energetic Particle (SEP) event catalog. SOHO Michelson Doppler Imager (MDI) Phase II: Find secondary measures that influence an AR’s probability of producing an event, e.g., size, flare history, magnetic isolation (fewer flares for > 10 active regions on disk).
HIGHLIGHT: Rotating Solar Coronal Holes and Periodic Modulation of the Upper Atmosphere,Lei, Thayer, Forbes et al. III. Energy Partitioning at High Latitudes and Density Implications, Jeff Thayer, Co-I Rotating coronal holes give rise to periodic fast solar wind streams and corotating interaction regions (CIRs) that modulate the energy input into the geospace system Density at 400 km Percent density change
CHAMP Density Residuals Whole Atmosphere Model (WAM) IV. Wave Forcing from the Lower Atmosphere, Rashid Akmaev, Co-I HIGHLIGHT: Midnight Temperature and Density Maximum, Akmaev, Fuller-Rowell This is the first model simulation to capture the seasonal-latitudinal and amplitude of the MTM, and to account for its lower-atmosphere origin
IV. Wave Forcing from the Lower Atmosphere, Rashid Akmaev, Co-I HIGHLIGHT: Stratospheric Warming Effects on the Thermosphere, Akmaev, Fuller-Rowell, Forbes, Bowman • Recent ionospheric and satellite drag data reveal potential signatures of stratwarm effects. NOAA’s US-TEC operation product Courtesy M. Fedrizzi
VII. Satellite Drag in the Reentry Region, Brian Argrow, Co-I HIGHLIGHT: Large Longitudinal Density Variations Derived from SABER Temperature Measurements, Forbes, Bruinsma, Oberheide Use tidal theory, wind and temperature Observations to model density variability in the re-entry regime. Validation with CHAMP Data Longitude variability in density is observed near 400 km that is consistent, within the context of tidal theory, with the density variability derived between 80 and 110 km
CONCLUSIONS • Through NADIR we are understanding better the physical processes that drive satellite drag variability and that underly a predictive capability. • The quiet Sun has enabled • us to better isolate drag variability • associated with “meteorological influences” from below. • We look forward to new insights that derive from increasing levels of solar activity and different types of solar wind -magnetosphere - ionosphere - thermosphere coupling.