Download
1 / 23
230 likes | 256 Views
Importance of thin aquitard in regional flow systems, aquitard characterization, aquifer properties, and virus detection in groundwater. Discusses aquitard variability and its implications for water flow pathways.

E N D
Evaluation of a bedrock aquitard for regional- and local-scale groundwater flow Kenneth R. Bradbury, Madeline B. Gotkowitz, and David J. Hart Wisconsin Geological and Natural History Survey, University of Wisconsin-Extension, Madison, WI, USA Three-dimensional geologic mapping for groundwater applications Workshop: Denver, Colorado 10/27/07
Purpose of this talk… Demonstrate the importance of a thin aquitard in a regional flow system Show how regional and local characterizations differ
Units in the “sandstone” aquifer aquifer aquitard aquifer
Core of Wonewoc sandstone Core of Eau Claire shale and Mt Simon sandstone
Here, the aquitard makes up only 10 feet of the 235-ft thick formation. Eau Claire aquitard is not the same as Eau Claire Formation Typical geologic log
Aquitard presence indicated by gamma signature and head drop
Is the aquitard continuous? Natural gamma logs provide excellent stratigraphic correlation across the county
Thickness of “shale” facies ranges from 50 meters to absent in Dane County
Hydraulic conductivity • Kh= 6 x 10⁻⁵ m/day (packer/slug tests) • Kv = 2.2x10⁻⁴ m/day (regional model calibration) • Measurement of K is difficult; field measurement of Kv is nearly impossible • Although we generally expect Kh>Kv, we also know that regional values of K are usually greater than local values.
Eau Claire aquitard Eau Claire is part of a 3D county-wide model
Pumping has caused significant drawdown in the deep sandstone aquifer and steep vertical hydraulic gradients across the aquitard Drawdowns in feet
Downward flow potential: hatching shows areas where there is a downward hydraulic gradient from the upper to the lower bedrock aquifers
Regional conclusion • Eau Claire is a “good” aquitard, and is a key part of the regional groundwater system • In general, water beneath the aquitard should be quite old (100’s-1000’s of years) But what about locally?
Profiles of head in the interior of aquitards are critical for understanding and evaluation • Hydrostratigraphy often does not match “classic” rock stratigraphy • Hydraulic properties not always apparent from lithology • Aquitards are rarely monolithic or uniform
Aquitard characterization: • The Eau Claire Formation includes intervals of varying thicknesses of shaleysandstone and shale. • variation results from changes in the regional sedimentary depositional environment • supports the variable thickness of the aquitard interpreted from geologic logs. • The aquitard consists of two hydrofacies • an upper, more conductive, and thicker unit of interbedded sandstone and shale • a lower, less conductive and thinner shale facies.
Locally, viruses detected in deep groundwater in two city wells
Madison Municipal Wells Sampled • Wells 7 and 24 located in dense urban area Well #7 Lake Mendota Well #24 Lake Monona 5 km
Human enteric viruses were detected in two wells cased below the aquitard Travel time must be less than 2 years because this is the upper time limit for virus survival in groundwater.
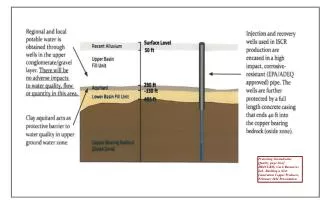
Possible Transport Pathways Through Aquitard • fractures • depositional or erosional stratigraphic windows • down cross-connecting open wells or boreholes • along damaged, deteriorated, poorly sealed well annulus or breaches in well casings The exact transport routes from the surface to depth are presently unclear, but calculations show that transport via groundwater flow is possible if the aquitard is fractured
Implications • Describing the three-dimensional spatial distribution and hydrogeologic properties of aquitards at all scales is essential for proper understanding and predictive simulation of groundwater systems. • Aquitards should receive the same attention as aquifers in groundwater investigations • Regional- and local-scale properties may differ • The roles of heterogeneities, fractures, and well construction should not be ignored