Basic Experimentation
Basic Experimentation. Notes developed by Ken Lulay for ESCO Mechanical Engineering University of Portland July 2008. What to bring? . Attendees should bring: Scientific calculator Ideas for experiments they would like to do at ESCO The following should be provided:


Basic Experimentation
E N D
Presentation Transcript
Basic Experimentation Notes developed by Ken Lulay for ESCO Mechanical Engineering University of Portland July 2008
What to bring? • Attendees should bring: • Scientific calculator • Ideas for experiments they would like to do at ESCO • The following should be provided: • Two brands of paperclips • Popcorn, scale, microwave
Objectives • By the completion of this class, you will be able to: • Understand basic experiment “vocabulary” • Design and analyze a single variable experiment (2 level factor) • Design and analyze a multi-variable experiment (2 level factors)
Basic Experimentation - Overview • Experiment Basics (30 minutes) • Single variable experiments – design and analysis (2 hours) • Multi-variable experiments – design and analysis (4 hours)
Overview of Experiment Basics • Differences between testing and experimenting • Experimental variables • Errors: systematic and random
Experimenting and testing… …both require obtaining data (taking measurements), but… …what are they and how are they different?
Testing • Testing may involve investigating only one set of conditions. • Usually evaluating performance • Example: determine strength of a material • May be a standardized test (ASMT, ISO) • Often has pass/fail criteria • Does it meet specifications or not? • We will not be discussing “testing”
Experimentation • Performed to increase knowledge • how things perform under differing conditions • Vary the input to determine the response • Requires more than one set of conditions (design points) • Evaluate “better/worse” (not pass/fail)
Experimentation & Testing A BIG difference: • Tests are often routine • Same tests done daily! • Analogous to daily commuting to work • Experiments are “unique” • Usually done only once! • Therefore, require more careful planning! • Analogous to a vacation trip
Variables • Variables are physical quantities that may or may not affect the results of an experiment or test. • Several types of variables are associated with any test and experiment: Controlled or Extraneous • Controlled variable are held constant or intentionally manipulated (changed) during an experiment. • Extraneous variables are not controlled. They are generally assumed to have no effect on the response (ex: ambient room temperature)
Variables Dependent or Independent • The magnitude (value) of dependent variables are dependent upon other variables whereas the magnitudes of independent variables are not • Ex: in an experiment to determine the effect of temperature change on the toughness of AISI 1045 steel, temperature would be an independent variable and toughness would be a dependent variable Continuous or Discrete (a.k.a Categorical) • Discrete variables cannot take on a continuous range of values. Ex: Red/Green; Company A/Company B. • Continuous variables can take on a continuous range. Ex: temperature, toughness, force
Terminology • Factor - an independent variable in an experiment - factor levels are intentionally varied in an experiment to see what the effect is on the response. • Factor Level - the target value of the factor. Example: pressure may be set to two levels: 0.5 Atm, and 1.0 Atm • Response - the thing to be measured. Example, if you want to determine the yield strength at different temperatures, the yield strength is the response.
Variables and Levels • Proper selection of appropriate variables and their levels is not trivial but is critical • Selecting proper factors and levels is worth the effort. Don’t rush this step. • Differences in factor levels: • Factor levels must be “well separated” • Far enough apart to be “different” (produce-ably and measurably) • Not too far apart to be “unreasonable” (non-linear responses can be an issue – may miss the optimum)
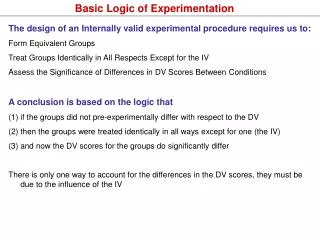
Purpose of experiments? • The sole purpose of our experiments will be to answer the following questions: Does changing one or more factor have a statistically significant effect on the response(s)? And if so, which factors appear to have the most significant effect?
Practice • A materials engineer wants to study the effect of molybdenum content in a particular high alloy steel on the yield strength at various temperatures. • For this experiment: • Define the factors and their levels • Define the response • Identify “all” variables and classify them • controlled/extraneous • discrete/continuous • dependent/independent
Practice (“answers”) • Factors (controlled): • Molybdenum content; levels: 5.1% and 5.2%? • Test temperature; levels: -50F, 1000F? • Also control: • Test bar geometry, chemistry (other than Mo), strain rate, measurement methods and systems, test methods and systems,… • Extraneous: humidity, … • Dependent: yield strength (response)
Errors Errors (measurement variation) are due to a number of factors: • Measurement error • error = measured value - true value • Changes in test specimen • Ex: one specimen has slightly larger diameter • Changes in environment • Ex: ambient temperature increase • Et cetera
Errors • The “true” value is the value one would obtain with a perfect measurement. • The true value is never known in an experiment • Therefore, error can never be known exactly, it can only be estimated using statistical analysis. • Errors are inherent in measuring devices and caused by uncontrollable variations within the experiment.
Systematic and Random Errors In any experiment, two types of error can exist: • Systematic • Random
Systematic Errors • Caused by underlying factors which affect the results in a “consistent/reproducible” and sometime “knowable” way • Sometimes referred to as “bias” • Not random • DANGER: can lead to false conclusions! • Discuss this now, but example to follow later • Can be managed (reduced effects) by properly designed experiments (randomizing the test conditions).
Causes of Systematic Errors • Unknown changes during the experiment • temperature, procedures, equipment, etc. • Different batches of material or samples • Et cetera
Random Errors • Show no reproducible pattern – they are random. • Sometimes referred to as “noise.” • Typically have normal distribution (bell shaped) averaging several readings can reduce random errors.
Practice • Consider the previous example (experiment to determine effect of varying molybdenum content and temperature on yield strength) • Make a list of possible systematic errors and random errors for the design on next slide…
Practice • The Experiment: • Two batches of steel: 2wt%Mo & 10wt%Mo • Test bars are machined by outside company • Two test temperatures: 50F, 150F • PRACTICE: • Make a list of possible systematic errors and random errors
Practice (“answers”) Possible systematic errors: • Batches of steel (chemistry variation of other elements) • How could this effect be mitigated? • Machining of specimens (did moly content affect machining quality? Were specimens machined in batches with different diameters?) • Temperature drift during testing (maybe from 52F towards 48F, and from 152F towards 148)? • Variation between beginning and end of test (measurement systems, operator, test equipment, test procedures…) How could systematic errors have been reduced?
Practice (“answers”) Possible random errors: • Measurement errors • Diameter of bars (maybe random) • Load cell variation • Others?
Review of Terminology • Do Exercise 1 (definitions) in the back of the booklet to review terminology.
BREAK TIME! Single Variable Experiments to follow
Overview of Single Variable Experiments • Basic Design of Experiments (DOE) • Example of “how not to” • Statistics and t-testing • Hypothesis testing • Confidence Intervals
Design of Experiments (DOE) • By careful design, errors can be mitigated • Systematic errors are mitigated by randomizing the test conditions (randomized run order) • Random errors are mitigated by increasing the number of data points • Design is a compromise of competing criteria: • Cost, time, availability of equipment, etc. • Control over variables • Importance of results and conclusion • CAREFUL PLANNING is REQUIRED! • Let’s look at a basic example…
Example:Single Variable Experiment • Wacky Engineer, a new employee at ESCO, believes that the color of paint applied to a tensile bar can affect the strength. • Let’s take a look at this experiment…
Single Variable Experiment • Determine if paint color affects strength of tensile bars • Factor 1: paint color • Levels: Red, Green • Other controlled variables: test specimen geometry and material (constant) • Response: yield strength of bar • Results: Red = 81.9ksi, Green = 80.2ksi • Did color of paint have an effect? • Not a well thought out experiment • We need more and better data…
Single Variable Experiment • New Experiment with more data: • paint five bars red and five green • Red paint is available, green paint is on backorder. • Your boss really wants data soon! • Test facility is available, so show progress: Paint and test red bars! • Green paint arrives, complete the testing!
Single Variable Experiment • The results: R: 80.3, 81.2, 82.1, 83.1, 82.2; Ave=81.9 G: 78.2, 82.1, 80.8, 81.6, 81.1; Ave=80.2 • The red bars were stronger on average. • Same operator did all testing. • Red bars were the first tensile bars he’s ever tested. • Did color of paint have an effect? • This is another poorly thought out experiment. • What are some problems with this experiment?
Another, Better Example Re-do the prior experiment, but randomize • Randomize by using the following run order: • R, G, G, R, G, G, R, R, G, R • why randomize? • Why would the following run order not be “OK”? • R, G, R, G, R, G, R, G, R, G
Better Example • The randomized run order results: R: 80.3, 81.2, 82.1, 83.1, 82.2; Ave=81.9 G: 78.2, 82.1, 79.8, 79.6, 81.1; Ave=80.2 • R & G averages are different but did color of paint really have an effect? • Averages are only part of the answer • “Statistically significant” difference depends upon both the averages and the variation.
Plot the Data 79 81 83 • Looks like Red paint increased the strength! • Will your boss believe this? • How certain are you that the effect is real? • How likely is this to be a “fluke”?
Probability Distribution • Assume distribution is “normal”!!! • Measurements are a sample of the total • We can never be 100% certain about experimental results (variation, error). • Can only estimate “likelihood” or “probability” f(x) a b
t-test • Comparing the averages is NOT sufficient! • The best way to answer “are they different” is with the t-test. • The t-test incorporates both the deviation of the data as well as the means.
t-test – what does it do? • Consider two sets of sampled data • Are their true means likely different? • What about these two sets? • t-test will help us decide Both sets have same averages
Basic Statistics • m= true mean • X = estimated mean based on finite sample size • s = true standard deviation • S = estimated standard deviated based on the finite sample size • n = number of samples xiis the value of the ith sample (Equation 1) (Equation 2)
Basic Statistics, Continued • Note: X is an estimate of the actual mean (m). It becomes closer to m with increasing sample size, n. X itself is a random sample of the true mean, m. • For normally distributed data: 68.3% of all data will be with in +/- 1 s 95.4% of all data will be with in +/- 2 s 99.7% of all data will be with in +/- 3 s
Hypothesis Testing • We want to determine if color of paint had an effect on strength (Red vs. Green, prior example). • Hypothesize there is no effect due to paint color (this is the so-called “null hypothesis” or H0=0). In other words, we claim that: mRed = mGreen • We have sample means (XR=81.9, XG=80.2) which are estimates for the true means (mRed, mGreen) but we can never know the true means exactly.
Statistics • Assume the deviations are the same (sR = sG) • “Pool” the deviations: • For our Paint Color experiment: nR = nG = 5, SR2 = 1.33; SG2 = 2.23 Sp2 = {(5-1)*1.33+ (5-1)*2.23} / {(5-1) + (5-1)} Sp2 = 1.78 (Equation 3)
t-test • We now define t0, which is from the t-distribution (don’t worry about what that means): • For our example: t0 = ABS{81.9 – 80.2} / {1.78 (1/5 + 1/5)}1/2 t0 = 2.06 (Equation 4)
t-test • So what is this “t0” number? • Notice the “effect” (difference between the two samples) is in the numerator, the variation (“noise”) is in the denominator. • The larger t0 is the greater the probability that the effect (difference) is real. How large is large? “Effect” “Error” or “variance”
t-test • To determine the t-distribution value we need to know the degrees of freedom and select a confidence level • Determine the degree of freedom in our experiment DOF = (nR - 1) + (nG - 1) = (5 - 1) + (5 - 1) = 8 • We need to compare t0 calculate with tabulated values from t-distribution with corresponding degrees of freedom (8) at some level of confidence • Confidence level is our choice, typically 95% or 99%.
t-distribution Table • We select 95% confidence as our criterion • For 95% confidence interval, a = 0.05 • There are 8 degrees of freedom in this experiment • From t-distribution: ta/2, DOF = t0.05/2, 8 = 2.31 • t-distribution values are obtained from tables in most statistics/experimentation books. Note, ta/2 – means we are using 2-sided or 2-tailed test which is appropriate for the hypothesis of mR =mG. If we were to ask the question is mR > mG, then we would use single-sided t-table (ta/1, DOF).
t-test • In our paint example t0 < ta/2, DOF (2.06 < 2.31) • t0 is too small to reject the null hypothesis at 95% confidence. • Therefore, we accept the null hypothesis (mRed = mGreen). • This does not mean we are 95% confident that the bars painted red were equal to the green. It means we cannot say with confidence that they are different. Next slide…