Download
1 / 13
140 likes | 354 Views
Discover the historical perspective, methodologies, and insights on assessing microbial diversity beyond cultivation. Learn about Molecular techniques, ARDRA, T-RFLP, DGGE, and Diversity Metrics like Shannon-Weaver and Simpson to uncover hidden microbial diversity.

E N D
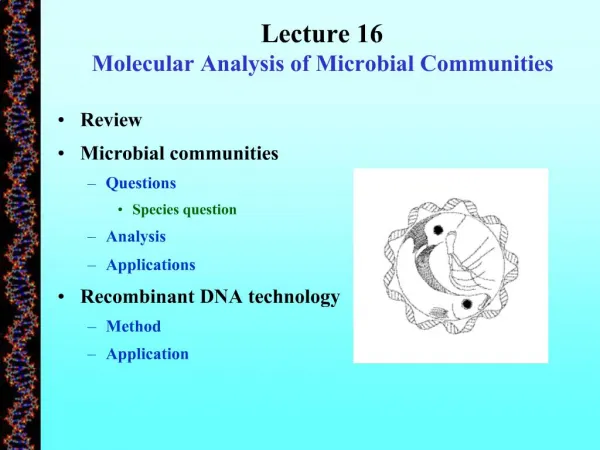
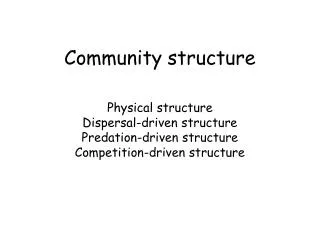
Analysis of Microbial Community Structure Historical Perspective on Microbial Diversity Assessing Diversity Alone Diversity With Phylogeny Diversity of Function
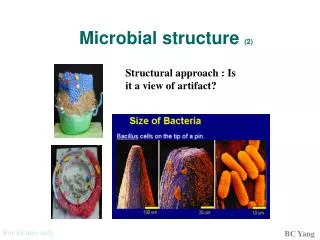
Historical Perspective on Microbial Diversity • Knowledge is limited by our tools. • Cultivation missed about 99.9% of no. estimates. • Both biomass and diversity underestimated. • Molecular techniques and phylogeny: • Independent of cultivation • Unknowns can be grouped with knowns
Study Diversity Independent of Cultivation • Extract DNA from sample (or not?) • PCR Amplification of 16SrDNA • Clone all amplicons • Screen clones for differences (e.g. ARDRA). • Document richness and evenness of clones. • Preliminary phylogeny • Sequence clones of interest. • Perform complete phylogenetic analysis; & identify known or prior documented unknown strains.
Ligate PCR amplicon into a cloning plasmid; transform host bacterium; isolate recombinant plasmids for sequencing of inserted 16SrDNA.
Screen Clones • ARDRA is an RFLP on the 16SrDNA amplified by PCR • RFLP = restriction fragment length polymorphism • ARDRA has been used: • - post-cloning • pre-cloning • isolates or communities • For screening clones with 16SrDNA, enzymes that separate plasmid DNA are used for clearer results.
Preliminary Phylogenetic Analysis • Fingerprints (banding patterns) can be converted to analog data based on presence or absence of bands of different sizes. • Pairwise comparison of all clone fingerprints will yield a similarity (distance) matrix. • Phylogenic tree can be computed from a cluster analysis of the matrix.
Complete Analysis 16SDNA Sequencing: 1) Dideoxynucleotides stop synthesis at different sites; different size fragments made for each sequence position. 2) Each ddNTP has a fluorescent label for easy specific detection as it’s separated by HPLC or electrophoresis.
Quick Assessment of Diversity“One band = One bug” (?)(little phylogeny information) • RISA (ribosomal intergenic spacer analysis) • Often get overlapping bands (on band = > 1 bug) • Phylogenetic information limited by 16SrDNA overlap • ARDRA (amplified ribosomal DNA restriction analysis) • Good for identification of isolates; esp. with multiple restriction enzymes. • Too many bands makes it hard to interpret mixed populations. • T-RFLP (terminal restriction fragment polymorphism) • Steps like ARDRA, but terminal 3’ end of gene is fluorescent • Multiple restriction enz. Give best results; maybe used to query RDP.
DGGE • Denaturing Gradient Gel Electrophoresis • Separated DNA of same size based on sequence differences. • Different sequences “behave differently at different amounts of denaturing chemical (or heat; see TGGE) • At some point 16SrRNA DNA strands completely separates. • Complete separation of PCR amplicon is hindered by GC-clamp added to one of the PCR primers.
Gradient Parallel for Analysis • Conditions change mostly due to size of amplicon. • May be applied at different taxa (groups) • Bands may be cut out and DNA cloned for phylogenetic analysis. • Larger bands more information.
Diversity Metrics: • Shannon-Weaver • Simpson