Download
1 / 1
10 likes | 135 Views
This analysis focuses on the mean sea surface salinity (SSS) as measured in September 2011, utilizing both in situ Argo float data and satellite observations from the Aquarius mission. It employs optimal interpolation techniques to enhance the quality of SSS data, while also smoothing measurement noise with a Hanning window. The findings indicate a pronounced seasonal cycle in the North Atlantic, highlighting sharp spatial gradients in SSS. The results validate Aquarius measurements against Argo data, showcasing significant advancements in ocean observing capabilities.

E N D
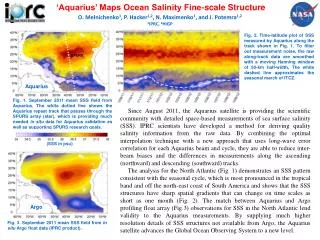
Argo Fig. 3. September 2011 mean SSS field from in situ Argo float data (IPRC product). ‘Aquarius’ Maps Ocean Salinity Fine-scale Structure O. Melnichenko1, P. Hacker1,2, N. Maximenko1, and J. Potemra1,2 1IPRC, 2HIGP Fig. 2. Time-latitude plot of SSS measured by Aquarius along the track shown in Fig. 1. To filter out measurement noise, the raw along-track data are smoothed with a moving Hanning window of 50-km half-width, The white dashed line approximates the seasonal march of ITCZ. SPURS Aquarius Fig. 1. September 2011 mean SSS field from Aquarius. The white dotted line shows the Aquarius repeat track that passes through the SPURS array (star), which is providing much needed in situ data for Aquarius validation as well as supporting SPURS research goals. Since August 2011, the Aquarius satellite is providing the scientific community with detailed space-based measurements of sea surface salinity (SSS). IPRC scientists have developed a method for deriving quality salinity information from the raw data. By combining the optimal interpolation technique with a new approach that uses long-wave error correlation for each Aquarius beam and cycle, they are able to reduce inter-beam biases and the differences in measurements along the ascending (northward) and descending (southward) tracks. The analysis for the North Atlantic (Fig. 1) demonstrates an SSS pattern consistent with the seasonal cycle, which is most pronounced in the tropical band and off the north-east coast of South America and shows that the SSS structures have sharp spatial gradients that can change on time scales as short as one month (Fig. 2). The match between Aquarius and Argo profiling float array (Fig.3) observations for SSS in the North Atlantic lend validity to the Aquarius measurements. By supplying much higher resolution details of SSS structures not available from Argo, the Aquarius satellite advances the Global Ocean Observing System to a new level. (SSS in psu)