Download
1 / 20
200 likes | 367 Views
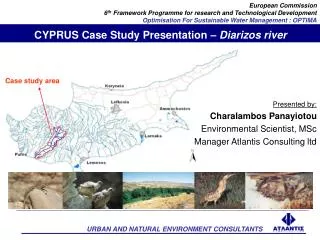
CYPRUS Case Study Presentation – Diarizos river. Presented by: Charalambos Panayiotou Environmental Scientist, MSc Manager Atlantis Consulting ltd. Case study area. – INTRODUCTION – GENERAL OVERVIEW OF DIARIZOS WATERSHED. GENERAL OVERVIEW.

E N D
CYPRUS Case Study Presentation – Diarizos river • Presented by: • Charalambos Panayiotou • Environmental Scientist, MSc • Manager Atlantis Consulting ltd Case study area
– INTRODUCTION – GENERAL OVERVIEW OF DIARIZOS WATERSHED
GENERAL OVERVIEW • The Diarizos river valley covers about 260 km2 in SW Cyprus and extends along approx. 33 km from headquarters to sea • Minimum elevation is 0 m and maximum elevation is 1800 m. • Bunding box [lat/long of upper left (lat: 458,978.47, long: 3,872,690.42) and lower right (lat: 488,606.67, long: 3,838,161.32) corner minimally
LANDUSE • Arminou dam • Number of communities in the watershed: 28 • 18 communities downstream of Arminou Dam and 10 communities upstream • Total Population: 3,550 inhabitats • mostly farmers
LANDUSE • Cultivated crops in watershed: DECARS • (1000 m2) • Citrus: 880 • Deciduous : 1460 • Olives: 250 • Vines: 130 • Fodder: 80 • Potatoes: 30 • Vegetables: 30 • TOTAL 2860
GEOLOGY • IGNEOUS ROCKS 43% • ( All are upstream of Arminou Dam ) • MAMONIA (MELANGE) 13% • CHALKS 19% • CHALKS AND MARLS 24% • ALLUVIUM 1%
WATER BALANCE • Dhiarizos Watershed Area up to Kouklia stream gauging weir: • Total area: 260 km² • Precipitation: 680 mm • Mean Annual Runoff (1965-1998) : 25 Million m³ (MCM) or 96mm • Median Annual Runoff (1965-1998) : 19.3 Million m³ (MCM) or 75mm
– PROGRESS – TASKS ACHIEVED TO THE PRESENT TIME
Dhiarizos River Basin The Dhiarizos River Basin consists of seven sub catchments 1 2 3 4 5 6 7
River Basin Topology SUB-2 SUB-1 The 4 Upper Catchment Start Nodes (SUB1-4) SUB-3 SUB-4 SUB-5 DRINK ARMINOU DAM Diversion to Kouris Dam KOURIS SUB-5 IRRIG FAULT 1 AVDIMOU-ALEKTORA-PARAMALI SUB-5 Diversion to villages WETLAND WELL SUB-6 DRINK Subcatchment 6 Wells for Drinking Water SUB-6 IRRIG Subcatchment 6 Wells for Irrigation SUB-6 PAFOS IRRIG WELL PISSOURI Diversion to Pissouri village SUB-7 DRINK This node arrangement represents the wells (Start Node) used for the water demands of the Pafos Irrigation Works SUB-7 SUB-7 IRRIG FAULT 2
WATER IN The main INFLOW to the basin for the year 2005 comes from the subcatchments runoff: Subcatchment 1 (Start Node) = 3 Mm3/ year Subcatchment 2 (Start Node) = 3.51 Mm3/ year Subcatchment 3 (Start Node) = 3.42 Mm3/ year Subcatchment 4 (Start Node) = 3.39 Mm3/year Subcatchment 5 (Start Node) = 7.10 Mm3/year Subcatchment 6 (Start Node) = 5.91 Mm3/year Subcatchment 7 (Start Node) = 3.77 Mm3/year Total Inflow from Subcatchments = 30.10 Mm3/year
The main basin’s OUTFLOW for the year 2005 goes to irrigation and drinking water: Irrigation = 2.08 Mm3/year Drinking Water = 1.01 Mm3/year Kouris Dam (Irrigation & Drinking) = 4.39 Mm3/ year Pafos Irrigation Works = 2.31 Mm3/ year Avdimou-Alektora-Paramali villages (Irrigation & Drinking) = 0.62 Mm3/ year Pissouri Municipality(Irrigation & Drinking) = 0.30 Mm3/ year Wetland Well = 0.01 Mm3/ year Total Basin Outflow = 10.72 Mm3/ year WATER OUT
The Dhiarizos river basin model network consists of: Four start nodes (Subcatchment 1- Subcatchment 4) describing the runoff from the four upper basin subcatchments. All four nodes end up in Arminou Dam. One Reservoir Node (Arminou Dam) represents the Arminou dam. This dam is used to divert Dhiarizos flows to Kouris Dam represented by an End Node (kouris) and to Dhiarizos valley for irrigation and aquifer recharge. Two Start Nodes (SUB5 Drinking Water Wells, SUB5 Irrigation Wells) and Two Demand Nodes (SUB5 Drinking Water, SUB5 Irrigation) in Subcatchment 5. One simulate the demand and corresponding obstructions from drinking water wells and the other simulates the demand and corresponding obstructions for irrigation wells. One Demand Node (Sub5 Fault) simulating Water losses at Fault in the Upper Diarizos Region. One Start Node (Subcatchment 5) simulating the runoff from Subcatchment 5. One End Node (Avdimou-Alektora-Paramali villages) simulating the obstructions for Avdimou-Alektora-Paramali villages. Node Description
Two Start Nodes (SUB6 Drinking Water Wells, SUB6 Irrigation Wells) and Two Demand Nodes (SUB6 Drinking Water, SUB6 Irrigation) in Subcatchment 6, that one simulates the demand and corresponding obstructions from drinking water wells and the other simulates the demand and corresponding obstructions for irrigation wells. One Start Node (Subcatchment 6) simulating the runoff from Subcatchment 6. One Start Node (Wetland Well) and Demand Node (Ag. Georgios Wetland) to simulate the well obstructions for Ag. Georgios Wetland. One End Node (Pissouri Municipality) simulating the obstructions for the Pissouri Municipality. One Start Node (Pafos Irrigation Wells) simulating the obstructions for the Pafos Irrigation Works. One Demand Node (Pafos Irrigation Demand) simulating the Water demand of Kouklia village that is located within the Dhiarizos basin. Node Description
One End Node (Pafos irrigation works) simulating the amount of water transferred outside the Dhiarizos basin for irrigation purposes. Two Start Nodes (SUB7 Drinking Water Wells, SUB7 Irrigation Wells) and Two Demand Nodes (SUB7 Drinking Water, SUB7 Irrigation) in Subcatchment 7, that one simulates the demand and corresponding obstructions from drinking water wells and the other simulates the demand and corresponding obstructions for irrigation wells. One Start Node (Subcatchment 7) simulating the runoff from Subcatchment 7. One Demand Node (Sub7 Fault) simulating the water losses occurring at the faults in the Dhiarizos basin. One Control Node (Kouklia Weir) simulating the weir at Kouklia. One End Node (end) describing the end of the Dhiarizos basin. Node Description
According to this scenario, there is a drought in the island and the desalination plants of Cyprus are prompted to produce all the water needed for drinking and irrigation. Optimization scenario 1
According to this scenario, there is water shortage in the island and the Ministry of Agriculture, Natural Resources and the Environment announces the reduction in the supply of irrigation water by 70%. Optimization scenario 2
According to Scenario 3, a community experiences great water losses in the irrigation piping system and decides to change the irrigation pipelines in order to decrease losses from the grid. The capital investment for the irrigation system is 240,000 €. Optimization Scenario 3
In all scenarios developed, the shortfall cost for Irrigation or the cost for buying 1m3 of water for irrigation during shortage of water was set at 0.957 €/ m3 which is the price for desalinated water in Cyprus and The use benefit or the benefit gained for using 1m3 of water was assigned at 0.20 €/ m3 which is the price for irrigation water in Cyprus. The shortfall cost for Drinking Water is the same as for irrigation water and was again assigned at 0.957 €/ m3 (price of desalinated water) and The use benefit or the benefit gained for using 1m3 of water was assigned at 0.57 €/ m3 which is the price for drinking water in the Dhiarizos river basin. Costs & Benefits