Download
1 / 33
330 likes | 434 Views
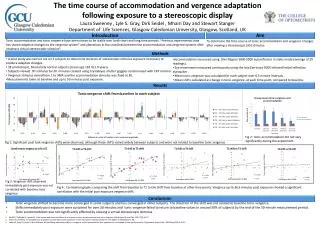
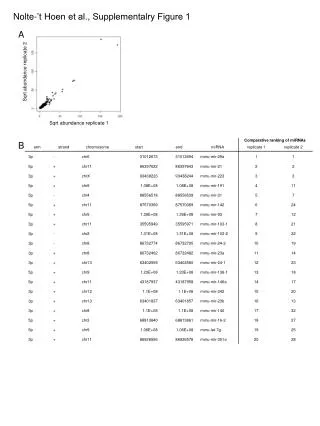
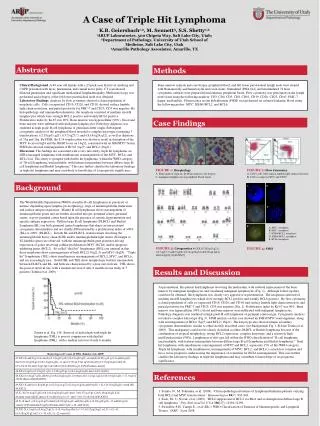
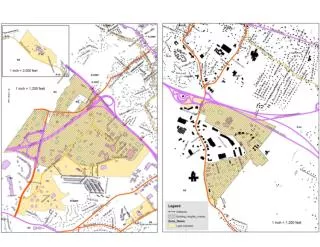
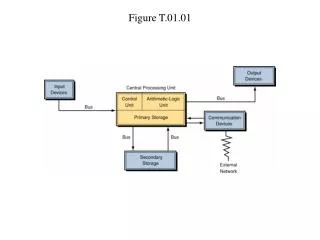
This compilation showcases a series of figures (T.01.01 to UT.01.89) that illustrate diverse data trends and patterns. Each figure provides insight into key statistical findings and visual representations, emphasizing their significance in research analysis. From temporal dynamics to comparative studies, these figures enable a clear understanding of complex datasets, making them valuable for academic and professional references. Explore how these visual tools can enhance data interpretation and decision-making processes.

E N D