Diagnosis using computers
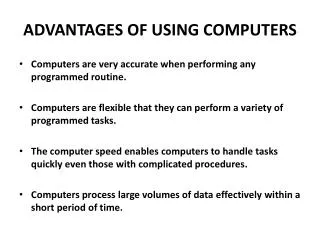
This study explores the impact of refined diagnostic methods on therapeutic success rates across three subtypes of a disease (A, B, and C). With success rates averaging 75% for subtype A and lower for B and C, our focus is on how higher resolution in diagnosis—achieved through advanced observations and cellular understanding—can improve outcomes without developing new therapies. The findings highlight critical metabolic deregulations and their morphological implications, backed by extensive clinical data, driving better-targeted treatments and insights into health management.


Diagnosis using computers
E N D
Presentation Transcript
One disease Three therapies
Clinical Studies In average 75% 55% 35% Success
A B C 100% 60% 65% 40% 40% 85% 10% 90% 5%
100% A 91,7% 90% B 85% C
Therapeutic success improved because of the refined diagnosis 91,7% 75% Without developing any new therapies
A higher resolution of dividing a disease into subtypes improves therapeutic success rates How do we obtain a higher resolution of diagnosis that is clinically relevant?
Looking at cells from outside The microscope
Details of Metabolism: The hemogram
Diagnostics crabwise • Deregulation of metabolism causes disease • Occasionally, they also lead to characteristic changes in tissue morphology or the hemogram.
Diagnostics based on details • A small number of genetic variations, transcription levels, and protein expression levels are routinely measured in single assays.
Desirable • Looking into cells and not onto cells • A protocol of what is going on in the cells
In addition desirable • A patients metabolism in a bird‘s eye view
DNA Chip Tissue Expression profile
Morphological differences and differences in single assay measurements are the basis of classical diagnosis A B
What about differences in the profiles? Do they exist? What do they mean? A B
Are there any differences between the gene expression profiles of type A patients and type B patients? 30.000 genes are a lot. That's to complex to start with Let‘s start with considering only two genes: gene A und gene B
In this situation we can see that ... A B ... there is a difference.
A new patient A B
The new patient A A B Here everything is clear.
The normal vector of the separating line can be used as a signature .... the separating line is not unique
Example: gene 1 is the signature Or a normal vector is the signature: if x1 and x2 are the two genes in the Diagram Using all genes yields:
Unfortunately, expression data is different. What can go wrong?
Gene A is important Gene B is important Gene B low Gene A high A A Gen B high Gene A low B B
New patient ? A B
Problem 1: No separating line Problem 2: To many separating lines
In praxis we look at thousands of genes, generally more genes than patients ...
An in 30000 dimensional spaces different laws apply ... 1 2 3 30000
Problem 1 never exists! • Problem 2 exists almost always! Spent a minute thinking about this in three dimensions Ok, there are three genes, two patients with known diagnosis, one patient of unknown diagnosis, and separating planes instead of lines OK! If all points fall onto one line it does not always work. However, for measured values this is very unlikely and never happens in praxis.
With more gene than patients the following problem exists: Hence for microarray data it always exists
From the data alone we can not decide which genes are important for the diagnosis, nor can we give a reliable diagnosis for a new patient This has little to do medicine. It is a geometrical problem.
Whenever you have expression profiles from two groups of patients, you will find differences in their genes expression ... ... no matter how the groups are defined .
There is a guarantee that you find a signature: • which separates malignant from benign tumors • but also • Müllers from Schmidts • or using an arbitrary order of patients odd numbers from even numbers
In summary: If you find a separating signature, it does not mean (yet) that you have a nice publication ... ... in most cases it means nothing.
Wait!Believe me! There are meaningful differences in gene expression. And these must be reflected on the chips.
Ok,OK... On the one hand we know that there are completely meaningless signatures and on the other hand we know that there must be real disorder in the gene expression of certain genes in diseased tissues How can the two cases be distinguished?
They come in large numbers Parameters have high variances We have searched in a huge set of possible signatures They refect details and not essentials Under-determined models No regularization Overfitting
Under-determined models They come in large numbers Parameters have high variances
No regularization We have searched in a huge set of possible signatures When considering all possible separating planes there must always be one that fits perfectly, even in the case of no regulatory disorder
Overfitting They reflect details and not essentials 2 errors 1 error no errors Signatures do not need to be perfect
Examples for sets of possible signature • All quadratic planes • All linear planes • All linear planes depending on at most 20 genes • All linear planes depending on a given set of 20 genes High probability for finding a fitting signature Low probability that a signature is meaningful Low probability for finding a fitting signature High probability that a signature is meaningful
What are strategies for finding meaningful signatures? • Later we will discuss 2 possible approaches • Gene selection followed by linear discriminant analysis, and the PAM program • Support Vector Machines • What is the basis for this methods?
Gene selection When considering all possible linear planes for separating the patient groups, we always find one that perfectly fits, without a biological reason for this. When considering only planes that depend on maximally 20 genes it is not guaranteed that we find a well fitting signature. If in spite of this it does exist, chances are good that it reflects transcriptional disorder.
Support Vector Machines Fat planes: With an infinitely thin plane the data can always be separated correctly, but not necessarily with a fat one. Again if a large margin separation exists, chances are good that we found something relevant. Large Margin Classifiers