Download
1 / 29
290 likes | 434 Views
BONUS Annual Conference 2010. Uncertainty assessment of state-of-the-art coupled physical-biogeochemical models for the Baltic Sea. Presentation: Kari Eilola Swedish Meteorological and Hydrological Institute, Sweden. Point sources. Atmosphere. Rivers. ECOSUPPORT Work package 2.

E N D
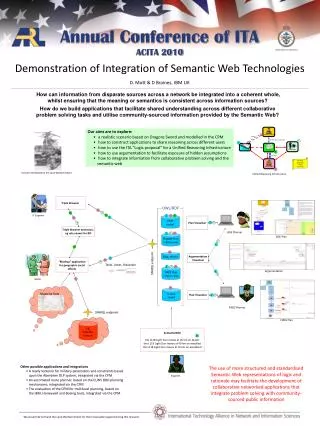
BONUS Annual Conference 2010 Uncertainty assessment of state-of-the-art coupled physical-biogeochemical models for the Baltic Sea Presentation: Kari EilolaSwedish Meteorological and Hydrological Institute, Sweden
Point sources Atmosphere Rivers ECOSUPPORT Work package 2 1. Three coupled physical-biogeochemical models calculate changing concentrations of nutrients and organic matter in the Baltic Sea
Point sources Atmosphere Rivers ECOSUPPORT Work package 2 2. Three time periods • 1850-2006: Hindcast from “pristine” to present conditions • 1960-2100: Scenarios forced by down scaled climate GCM’s • 1961-2006: Hindcast/validation/control period of scenarios
ECOSUPPORT WP2 Uncertainty assessment of state-of-the-art coupled physical-biogeochemical models for the Baltic Sea Authors:K. Eilola1, B. G. Gustafson2, R. Hordoir1, A. Höglund1, I. Kuznetsov3, H. E. M. Meier1, T. Neumann3, O. P. Savchuk21. Swedish Meteorological and Hydrological Institute, Sweden 3D Model: RCO-SCOBI (2nm) 2. Baltic Nest Institute, Resilience Centre, Stockholm University, Sweden 1D Model: BALTSEM (13 basins)3. Baltic Sea Research Institute Warnemünde, Germany 3D Model: ERGOM (3nm)
ECOSUPPORT WP2 Uncertainty assessment of state-of-the-art coupled physical-biogeochemical models for the Baltic Sea Authors:K. Eilola1, B. G. Gustafson2, R. Hordoir1, A. Höglund1, I. Kuznetsov3, H. E. M. Meier1, T. Neumann3, O. P. Savchuk21. Swedish Meteorological and Hydrological Institute, Sweden 3D Model: RCO-SCOBI (2nm) 2. Baltic Nest Institute, Resilience Centre, Stockholm University, Sweden 1D Model: BALTSEM (13 basins)3. Baltic Sea Research Institute Warnemünde, Germany 3D Model: ERGOM (3nm)Results in SMHI report (www.smhi.se):K. Eilola, B. G. Gustafson, R. Hordoir, A. Höglund, I. Kuznetsov, H. E. M. Meier, T. Neumann, O. P. Savchuk, 2009,Quality assessment of state-of-the-art coupled physical-biogeochemical models in hind cast simulations 1970-2005, Rapport Oceanografi No.101, SMHI, Norrköping, Sweden.
ECOSUPPORT WP2 Model validation/intercomparison • State-of-the-art models at the beginning of the project• Different nutrient loads and initial conditions• Same physical forcing 1961-2006 (ERA40-RCA)• Validation data 1970-2005 at standard depths from Baltic Environmental Database (BED)
ECOSUPPORT WP2 Model validation/intercomparison • State-of-the-art models at the beginning of the project• Different nutrient loads and initial conditions• Same physical forcing 1961-2006 (ERA40-RCA)• Validation data 1970-2005 at standard depths from Baltic Environmental Database (BED) • First results. Work is in progress. Validation will be repeated with updated forcing and final improvements of models
ECOSUPPORT WP2 Main conclusions • All models and the ensemble mean describe the variability of biogeochemical cycles and hypoxic area well• Ensemble mean cod reproduction volume and DIN and DIP in the Gulf of Bothnia and in the deepest parts of the Gulf of Finland need improvement• The ensemble mean is relatively strongly influenced by any one model member that by some reason give very poor results in some region• Uncertainties are related to bioavailable fractions of nutrient loadings from land and key processes like sediment fluxes that are presently not well known
Baltic Sea Station list RESULTS SEASONAL ECOSUPPORT Monthly mean 1970-2005 Observations: Data at Standard depths Model ensemble mean*: Data interval 1 meter (*average of all models mean values)
RESULTSSEASONAL ECOSUPPORT Monthly mean 1970-2005
RESULTS ANNUAL ECOSUPPORT Annual average 1970-2005 Salinity Solid line: BED data mean value Grey shaded area: 1 standard deviation Dashed line: Ensemble mean value Blue shaded area: Range of ensemble min and max values (ensemble spread) Station list
RESULTSANNUAL ECOSUPPORT Annual average 1970-2005 Salinity Station list
RESULTSANNUAL ECOSUPPORT Annual average 1970-2005 Oxygen Station list
RESULTSANNUAL ECOSUPPORT Annual average 1970-2005 Phosphate Station list
RESULTSANNUAL ECOSUPPORT Annual average 1970-2005 All observations 1969-1998 Phosphate Anoxic All observations 1969-1998 Highly non-linear oxygen dependence
RESULTSANNUAL ECOSUPPORT Annual average 1970-2005 Nitrate Station list
Station number 1. Anholt E 2. Bornholm Deep BY5 3. Gotland Deep BY15 4. Gulf of Finland W LL07 5. Bothnian Sea SR5 6. Bothnian Bay F9 RESULTSANNUAL ECOSUPPORT Ensemble cost function 1970-2005 Nitrate 0 C < 1 (good) 1 C < 2 (reasonable) 2 C (poor) M-D>SD Station list
RESULTSANNUAL ECOSUPPORT Cost function 1970-2005
RESULTS ECOSUPPORT Hypoxic area and cod reproduction volumeBaltic proper Baltic Proper area defined by the colored depth scale
RESULTS ECOSUPPORT Hypoxic area and cod reproduction volumeBaltic proper Annual average bottom area covered with O2 < 2 ml/l Annual average water volume with O2 > 2 ml/l and salinity > 11psu
Nutrient loading ECOSUPPORT Baltic Sea bioavailable nitrogen loads Differences between model loadings of N (error bar) are in the range 14-25 % of the ensemble average supplies (grey bar).
Nutrient loading ECOSUPPORT Baltic Sea bioavailable phosphorus loads Differences between model loadings of P (error bar) are in the range 42-56 % of the ensemble average supplies (grey bar).
Sediment nutrient pool ECOSUPPORT Baltic Proper sediment content N P Spread between modelled sediment contents of N and P (blue shaded area) is in the range 140-150 % of the ensemble average content (dashed line).
ECOSUPPORT WP2 Challenges and future outlook • Ongoing discussions about the introduction of harmonized nutrient loadings to the models and about the key processes that cause uncertainties for the sediment pools and fluxes•The atmospheric forcing of the models will be updated•The model calibrations and validations will be repeated with updated forcing and nutrient loading•Methods to quantify model ensemble results and uncertainties related to the different models results will be further discussed and developed•The results from each individual model and the causes to differences between models will be further analyzed
ECOSUPPORT WP2 Main conclusions repeated • All models and the ensemble mean describe the variability of biogeochemical cycles and hypoxic area well• Ensemble mean cod reproduction volume and DIN and DIP in the Gulf of Bothnia and in the deepest parts of the Gulf of Finland need improvement• The ensemble mean is relatively strongly influenced by any one model member that by some reason give very poor results in some region• Uncertainties are related to bioavailable fractions of nutrient loadings from land and key processes like sediment fluxes that are presently not well known
Thank you !Questions ? Advanced modeling tool for scenarios of the Baltic Sea ECOsystem to SUPPORT decision making
The ERGOM, RCO-SCOBI and BALTSEM models are similar in that they handle dynamics of nitrogen, oxygen and phosphorus including the inorganic nutrients, nitrate, ammonia and phosphate (and also silicate in BALTSEM and inorganic carbon in ERGOM), and particulate organic matter consisting of phytoplankton (autotrophs), dead organic matter (detritus) and zooplankton (heterotrophs). Primary production assimilates the inorganic nutrients by three functional groups of phytoplankton, diatoms, flagellates and others, and cyanobacteria. Organic material may sink and accumulate in the model sediment as benthic nitrogen and phosphorus (and silicate in BALTSEM).
Key differences: • Differences in treatment of dead organic matter: one state-variable for each nutrient vs. a single variable with constant N/P ratio • Differences in parameterizations of P sediment dynamics, in particular redox dependent P processes • Resuspension and sediment transport: mechanistic description (from waves and currents) vs. simple parameterization • Resolving coastal boundary and deep pits vs. large-scale horizontally integrated sub-basins • Different vertical resolution • In addition there are other “minor” quantitative (relationships) and qualitative (numerical values of constants) differences in parameterizations of similar pelagic and sediment biogeochemical processes that have not been listed and analyzed yet.
ECOSUPPORT Sediment concentrations discussion Theorethical consideration based on decomposition and burial rates in the models. The sediment N turnover time scales in the models vary from about 1 to 4 yr The time scales of steady state in the sediment N vary from about 5 to >25 yr