Download
1 / 51
510 likes | 525 Views
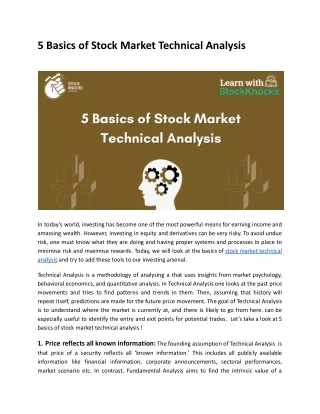
The technical analysis provided by Traders Mantra is the book on Stock market analysis. It includes all essential ways to analyze stock market charts such as Candlestick patterns, RSI, Volume, Bollinger Bands, Moving average, Elliott wave, Dow theory, Gap analysis and a few more.

E N D
TECHNICAL ANALYSIS Basic & Secondary knowledge Compiled By Traders Mantra Team
Preface The stock market is a place where market participants can access any publicly listed company and trade from their point of view, as long as there are other participants who have an opposing point of view. After all, different opinions are what make a market. What moves the stock? The price moves because of expectation of news and events. The news or events can be directly related to the company, industry or the economy as a whole. For instance the appointment of Narendra Modi as the Indian Prime Minister was perceived as positive news and therefore the whole stock market moved. Where do you fit in? Each market participant has his or her own unique style to participate in the market. Their style evolves as and when they progress and witness market cycles. Their style is also defined by the kind of risk they are willing to take in the market. Irrespective of what they do, they can be categorized as either a trader or an investor. There are different types of traders: oDay Trader – A day trader initiates and closes the position during the day. He does not carry forward his positions oScalper – A type of a day trader. He usually trades very large quantities of shares and holds the stock for very less time with an intention to make a small but quick profit. oSwing Trader – A swing trader holds on to his trade for slightly longer time duration, the duration can run into anywhere between few days to weeks. Some of the really successful traders the world has seen are – George Soros, Ed Seykota, Paul Tudor, Micheal Steinhardt, Van K Tharp, Stanley Druckenmiller ,JIM SIMONS etc The Index There are two main market indices in India. The S&P BSE Sensex representing the Bombay stock exchange and CNX Nifty representing the National Stock exchange. Index construction methodology It is important to know how the index is constructed /calculated especially if one wants to advance as an index trader. As we discussed, the Index is a composition of many stocks from different sectors that collectively represent the economy’s state. To include a stock in the index, it should qualify certain criteria. Once qualified as an index stock, it should continue to qualify Traders Mantra 1
on the stated criteria. If it fails to maintain the criteria, the stock gets replaced by another stock that qualifies the prerequisites. Based on the selection procedure, the list of stocks is populated. Each stock in the index should be assigned a certain weightage. Weightage in simpler terms defines how much importance a certain stock in the index gets compared to the others. For example, if ITC Limited has 7.6% weightage on the Nifty 50 index, then it is as good as saying that the 7.6% of Nifty’s movement can be attributed to ITC. The obvious question is –How do we assign weights to the stock that make up the Index? There are many ways to assign weights, but the Indian stock exchange follows a free-float market capitalization method. The weights are assigned based on the company’s free-float market capitalization, the larger the market capitalization, the higher is the weight. Free float market capitalization is the product of the total number of shares outstanding in the market and the stock price. For example company, ABC has 100 shares outstanding in the market, and the stock price is at 50 then the free-float market cap of ABC is 100*50 = Rs.5,000. Traders Mantra 2
What is Chart ? A chart is a historical representation of data in which data is represented in various ways. Data representation can vary with different time frames. There are many ways of data representation, you can represent the same data using a line or a chart or pie chart anyone that you like and understands better. What is Timeframe In trading? Data is represented in multiple periods of time. The majority of platform give time frame starts from 1sec to 1 month for premium members, for a free user, it’s from 1 min to 1 month. There are different types of traders in every market like short term, midterm, and long term traders. The short-term traders mostly use 5 min to 1-hour timeframe charts for trading. The midterm traders use 4-hour to 1-day timeframe charts for trading. The long-term traders use mostly weekly and monthly timeframe charts for trading. Now let us understand some important terms in trading: What did the term define bullish and bearish in the market? The bullish word itself gives a meaning aggressive, and although in the financial market this term used refers to market sentiment when a security price is in an uptrend (makes higher and high). Bearish when a security price is in a downtrend (makes lower low). What is higher high (HH), higher low (HL), lower high (LH) and lower low (LL)? We all know when the market is trending it neither moves straight up or down unless there is a piece of fundamental news released. When the security is bullish it moves to make Higher High (HH) and Higher Low (HL). In a nutshell, when prices move upwards and it makes a correction slightly lower and makes a new higher high (HH). Same as it is, when the security is bearish it moves Lower low (LL) and Lower High (LH). We can say that price moves downwards and make a slightly high move and follows the major trend of lower low (LL). Traders Mantra 3
Now let’s talk about some popular various types of charts used in trading. Types of charts Candlestick Chart This chart is the most popular and widely used for trading. Each and every platform have this candlestick chart. This candlestick was developed by a Japanese rice merchant in the late 1700s to track the price action of rice futures. Often this candlestick is also called “Japanese Candlestick”. This candlestick consists of four prices. Prices indicate open, high, low, and close (OHLC). Traders Mantra 4
Heikin Ashi (HA) Heikin Ashi candlesticks if a side branch of Japanese candlestick. It uses the data of Japanese candlestick (i.e., OHLC) and used to plot Heikin Ashi candles. Heikin Ashi candlestick calculation: Open = (open of previous bar + close of previous bar)/2. Close = (open + high + low + close)/4. High = the maximum value from the high, open, or close of the current period. Low = the minimum value from the low, open, or close Traders Mantra 5
LINE CHART : A Line chart is the easiest and the simplest trading chart in trading. This chart is plotted by the close price of the security under a given timeframe. This chart is quite easy to trade, but have some limitation because it not provides proper data for traders who have a strategy based upon price and or something like that. Traders Mantra 6
BAR CHART ; A bar chart consists of OHLC price and a stick which has a small stick on the left and right on that stick which indicates open and close price respectively. There are more different trading charts like Renko, Kagi, Line Break, Point & Figure, etc. but not used quite often. So, it’s better to use a popular and better one available. History of candlestick In the early around 17th century, it was first used by rice traders for understanding the fluctuation of price. A person from the US named Steve Nison used this technique to understand Dow Jones and NYSE after 1850 and published his book “Japanese Candlestick Chart Techniques”. Munehisa Homma was the farmer who developed. What is Candlestick? A candlestick is a visual representation of price, specifically to display Open, High, Low, and Close (OHLC). A candlestick has 4 prices I.e., OHLC prices, which is used to form bars/body of the candlestick. A candlestick is also like a bar chart but has a body between open and close price. A candlestick can be green or red depending on opening and closing price or more specifically it can be bullish or bearish. Traders Mantra 7
So, what does bullish and bearish candlestick means? When the closing price is greater than the opening price then it should be considered as bullish candlestick and when the open price is less than the closing price then it’s a bearish candlestick. The below Image will make you clearly understand. Let’s have some basic knowledge of candlestick patterns : Traders Mantra 8
What is a Doji? A Doji is a price reversal candlestick that have the same opening and closing. This candle signifies indecision in the market between buyers and sellers. This candle mostly forms at the end of the downtrend or uptrend and looks like a plus sign. It has small decent wicks with the same open and closing price or negligible body. There are different types of Doji :- Long Legged Doji: It’s a candle that looks the same as Doji but has much longer wicks (shadows) than Doji. Mostly appears in a trend indicates strong indecision. Gravestone Doji: This Doji indicates that neither buyers nor sellers are active and it’s a bearish reversal candlestick. Between the opening and closing of this candle, buyers pushed the market upside but afterward seller take over the market and closed at the same opening. Traders Mantra 9
This type of Doji often found at the uptrend, usually nearby resistance indicating selling pressure. Dragonfly Doji: This type of Doji is a bullish reversal candlestick where sellers push the market downside but buyers take over the market and closed at the same opening price. This type of Doji often found at a downtrend, usually at the support level of the market indicating buying pressure. Traders Mantra 10
What is Engulfing Candlestick? Engulfing is a trend reversal candlestick which consists of two candles, in which the end candle (2nd candle) fully engulfs the entire body of the 1st candle. Engulfing candle can differ in the form whether it’s an uptrend or downtrend. This type of candlestick has 2 types: Bullish Engulfing: Bullish Engulfing candlestick found in a downtrend indicating the beginning of a bullish trend (uptrend). In this candlestick, the 2nd candle will engulf the 1st red candle's entire body and closed above previous candle highs. This indicates a huge surge in buying pressure. Bullish Engulfing can appear in between continuous uptrend also, it doesn’t mean to be traded but with some sort of strategy to increase the profit factor and winning percentage. How to trade Bullish Engulfing candlestick: Buy after the candle fully closed and stop loss below the low of the candle and take profit is up to next resistance. Traders Mantra 11
EXAMPLE: Bearish Engulfing: It’s the just opposite of a bullish engulfing candlestick which found in an uptrend indicating the beginning of the bearish trend (downtrend). Here 1st candle is small and bullish while the next candle engulfs the previous candle's body and closes below the low. Again, it can form anywhere but trade with strategy. Traders Mantra 12
How to trade Bearish Engulfing candlestick Sell after the candle fully closed and stop-loss above the high of the candle and take profit is up to next support. What is Hammer Candlestick ? Hammer candlestick looks like a hammer and it’s a standalone candlestick which often found at the bottom of a downtrend having a long wick below its body indicating bulls taking control overbears and the market is most likely to reverse. A hammer can be bullish or bearish, color doesn’t matter in it and works the same. The hammer candle itself represents that initially bears pushed the price down heavily and after that bull has taken over controls the price closes nearby its open price Traders Mantra 13
Hammer and Hanging Man look the same the only difference is formed in a trend. How to Identity Hammer Candlestick ? Before considering any candlestick as a hammer check few characteristics: Open and close of the candlestick is not so far. The length of the candle should be twice or thrice of the body or more. The candle should appear after a good downtrend, not a short-term downtrend. How to trade Hammer candlestick ? Buy after the closing of the candle and stop loss below the low of the candle and take profits is up to you but we consider it till previous resistance. EXAMPLE As you can see after Hammer candlestick market trading higher and higher. Traders Mantra 14
What is Hanging Man Candlestick? Hanging Man candlestick is the same as hammer candlestick the only difference between is it often found on the top of the up-trending market, having a long wick below its body and the market is most likely to reverse. Color doesn’t matter and works the same. How to Identity Hanging Man Candlestick? oOpen and close of the candlestick is not so far. oThe length of the candle should be twice or thrice of the body or more. oThe candle should appear after a good downtrend, not a short-term Downtrend. How to trade Hammer OR HANGING MAN candlestick: Buy after the closing of the candle and stop-loss above the high of the candle and take profits is up to you but we consider it till previous support. After Hanging Man appeared, we can sell a heavy fall giving us a good profit. What is Inverted Hammer Candlestick? Inverted Hammer is a single candlestick that looks like a turnabout hammer, usually found in a downtrend consisting of a long wick/shadow on its upper body. The colour of the candle Traders Mantra 15
doesn’t matter, it can be bullish or bearish. This candle itself represents rejection from the lower price (or any important key level). Inverted Hammer and Shooting look the same the only difference is formed in a trend. How to Identity Inverted Hammer Candlestick? oOpen and close of the candlestick is not so far oThe length of the candle should be twice or thrice of the body or more. oThe candle should appear after a good downtrend, not a short-term downtrend . How to trade Inverted Hammer candlestick: Buy after the candle fully closed and stop loss below the low of the candle and take profit is up to next resistance. Traders Mantra 16
What is Shooting Star Candlestick ? It’s the same candlestick as Inverted Hammer the only difference between these candles is it found in an uptrend, having a long wick above its body. Again, here color doesn’t matter and works the same. The candle itself represents that bulls pushed the market aggressively and bears have taken over the market and closed price near its opening price. How to Identity Shooting Star Candlestick? oOpen and close of the candlestick is not so far oThe length of the candle should be twice or thrice of the body or more oThe candle should appear after a good uptrend, not a short-term uptrend How to Trade Shooting Star candlestick ? Sell after the closing of the candle and stop-loss above the high of the candle and take profits is up to you but we consider it till previous support. Traders Mantra 17
Here a quick fall and heavy profits after shooting star appeared. What is the Marubozu candlestick? Marubozu is a Japanese candlestick pattern, consisting of a single candle. Marubozu is a Japanese word that holds the meaning “Bald”. Also, Marubozu has no upper and lower wicks which indicates that the instrument is traded heavily in either direction. There are 2 types of Marubozu: Bullish Marubozu Bullish Marubozu indicates that buyers are more interested in buying and the price immediately spikes. Here Open is equal to Low and close is equal to High. Usually, Bullish Marubozu appears in an uptrend which indicates that the trend is most likely to continue while appearing in a downtrend implies a possible trend reversal. Traders Mantra 18
Bearish Marubozu: Bearish Marubozu represents traders are selling aggressively which results in a spike down in price. The candle has its Open is equal to High and Close is equal to Low. It usually appears in a downtrend which indicates a continuation of the trend, while appearing in an uptrend implies possible trend reversal. “Let’s take a Real Example …” Always Trade candlesticks patterns wisely with proper risk management else your trading funds will always at high risk. Traders Mantra 19
Support and Resistance In this chapter we shall discuss the following; oWhat is Support and Resistance oHow to find Support and Resistance oWhat to do when a support/resistance break? oFakebreakout/breakdown oWhere to put stop loss? The concepts of trading level support and resistance are undoubtedly two of the most highly discussed attributes of technical analysis. Part of analysing chart patterns, these terms are used by traders to refer to price levels on charts that tend to act as barriers, preventing the price of an asset from getting pushed in a certain direction. Support and Resistance is one of the most used techniques in technical analysis based on a concept that's easy to understand but difficult to master. It identifies price levels where historically the price reacted either by reversing or at least by slowing down and prior price behaviour at these levels can leave clues for future price behaviour. There are many different ways to identify these levels and to apply them in trading. Support and Resistance levels can be identifiable turning points, areas of congestion or psychological levels (round numbers that traders attach significance to). The higher the timeframe, the more relevant the levels become. Basics: Support is a price level where a downtrend can be expected to pause due to a concentration of demand or buying interest. As the price of assets or securities drops, demand for the shares increases, thus forming the support line. On the other hand, resistance is a price level where an uptrend can be expected to pause to break selling of the assets. As the price of the asset increase, more trader starts booking profits and results Traders Mantra 20
Horizontal Support Line Traders Mantra 21
How to draw a Support line? The support points can be easily identified by looking at the chart. A support is where the price bounce back, look for that points where the price bounced back many times and draw a line connecting the support points. You will get a horizontal support line. See the chart example below: To draw a valid support line, you need at least two points on the chart. Horizontal Resistance Line How to draw a Resistance Line? A resistance is a point where the price of the asset rejected many times. The market tests the resistance and traders start booking profits that results in a drop in the price. You need at least two points to draw a valid resistance line. Traders Mantra 22
Breakout When the price breaks the resistance line and trade above the line is called a breakout. Market turns bullish after a valid breakout and traders start buying/opening long position in the asset. The more times a resistance point gets tested, the weaker it becomes. Majority of traders are waiting for a breakout of the resistance line to open long positions. A valid breakout will give good profits in the coming hour/days/weeks depends on the timeframe you are using to trade. Always wait for the confirmation of the breakout. Don’t open a trade instantly because the breakout maybe a fakeout. We will discuss fakeout below in this post. Breakdown When a support line is broken downwards it is called a breakdown. The market turns bearish after a breakdown. It’s a better idea to close all the long position when a breakdown confirmed. Many traders open short position after the breakdown and make good returns on their trades. Traders Mantra 23
This is a very good example of breakdown. Always wait for the confirmation of the breakdown. Don’t open a trade instantly because the breakdown maybe a fake breakdown. We will discuss fake breakdown below in this post. Fake Breakout Fake breakout or fakeout is a condition when the price breaks the resistance line and instantly comes below the resistance line in the next candle. No candle close above the resistance zone to call it a valid breakout. See the below example and you understand better. Traders Mantra 24
In the above chart price breaks the resistance line and comes back under the resistance line with a huge red candle. Traders those open a long just after the resistance line fakeout will be in huge loss or rekt. Always wait for the confirmation before opening any trade. Fake Breakdown Fake breakdown is a condition when the price breaks the support line and instantly comes above the support line. No new candle close below the support line to call it a valid breakdown. See the chart for better understanding. Those traders opened the short trades instantly after the support is broken are in huge loss because it is a fake breakdown not a valid breakdown. Always wait for the next candle for confirmation of the breakout/breakdown and then open the trades. Traders Mantra 25
Where to Put Stop Loss? Stop loss is a must thing for every trade. The cryptocurrency market is highly volatile and sometime the market plays against your analysis or expectations. Stop loss will help to minimize the loss and open room for better opportunities. Always open the trades after trend confirmation. If you are in doubt than leave it and wait for the next setup. Not every day is a winning day. The stop loss must be placed below/above 7- 9% of the trade. This is for normal trading (spot trading), adjust your stop loss according to the leverage used (if you are doing margin/futures trading). Previous Resistance Become Support The previous resistance line work as support zone for the market. Below is a perfect example of this. Bitcoin is respecting the previous resistance line as support. The same can be true for a support line. The previous support line will work as resistance when the market start moving upwards. Trading Indicators What is the RSI (Relative Strength Indicator) indicator? Relative strength Index or just RSI, is a prevalent indicator developed by J.Welles Wilder. RSI is a leading momentum indicator which helps in identifying a trend reversal. Relative Strength Indicator (RSI) is a momentum oscillator used by numerous technical traders to discover the speed and change in price movements. RSI stands for Relative Strength Index. RSI is a leading Indicator, which has a fixed oscillating range of 0 – 100. RSI below 30 considered to be oversold and above 70 overbought. Trading with RSI standalone is not a good strategy. Some traders use RSI to find divergence to find the best possible entry. Calculation of RSI But why you should know the calculation of RSI? As technical traders what’s going on behind it doesn’t matter, but for some people more likely who like to make bots and auto traders for automatic trading have to know these things to make something from that or modify it. Feel free to live the example section, if you’re a technical trader. Traders Mantra 26
Taking entry-exit using standalone RSI is not a good strategy while combining with other strategy and price action techniques will have better results. Always Trade indicators wisely with proper risk management else your trading funds will always at high risk Traders Mantra 27
What is RSI Divergence RSI (Relative Strength Index) Divergence is used by price action traders to enter or exit in any trade. An RSI Divergence is created when RSI (Relative Strength Index) line diverges the momentum of the market or we can say opposes the price with respect to RSI (Relative Strength Index). When the price is making Higher High but in RSI (Relative Strength Index) making lower low or price making Lower Low or RSI (Relative Strength Index) making Higher High can be said to be a divergence. There are 2 types of divergence: Traders Mantra 28
Bearish Divergence Bearish Divergence occurs when the market making a higher high with respect to RSI (Relative Strength Index) making a lower low is said to be Bearish Divergence. Bullish Divergence occurs when price making continuous lower low with respect to RSI (Relative Strength Index) making a higher high, then it’s called Bullish Divergence. What is Moving Average Convergence Divergence (MACD)? In the late seventies, Gerald Appel developed the Moving Average Convergence and Divergence (MACD) indicator. Traders consider MACD as the grand old daddy of indicators. Though invented in the seventies, MACD is still considered one of the most reliable momentum traders’ indicators MACD stands for Moving Average Convergence Divergence is a momentum indicator used by technical traders that calculates the interconnection between 2 EMA (Exponential Moving Averages). In MACD (Moving Average Convergence Divergence) there is fast EMA (Exponential Moving Average) of length 12, slow EMA of length 26, and a single line of length 9 by default in general. There is also a graph looking thing called histogram which is the Traders Mantra 29
difference between the MACD (Moving Average Converging Divergence) line and Single Line. Calculation MACD Line = 12 periods EMA (Exponential Moving Average) – period 26 EMA (Exponential Moving Average) Single Line = 9 period EMA (Exponential Moving Average) Histogram = the difference MACD Line and Single Line How to use it? Usually, traders use its crossovers for buy/sell or entries/ exits, but standalone using MACD (Moving Average Converging Divergence) is not a good idea. Use it with some kind of strategy. When the MACD line (Blue color) crosses over Signal Line (Red color) below the histogram then it’s a buy signal and when Signal Line (Red color) crosses below the MACD Line (Blue color) above the Histogram, then it’s a sell signal. Note: Crossover may happen anywhere and anytime which can be a false signal also. Traders Mantra 30
What is Moving Averages (MA)? Moving Average (MA) is a very simple and famous indicator used by the majority of the traders in their Technical Analysis. MA (Moving Average) uses the previous price data and average/ smooth out the price, an average is calculated over a specific period of time. Some traders use MA (Moving Average) to find trend direction and some for entry and exits because it cuts the noise from the market and smoothest out the price to understand the trend. There are various types of Moving Average: Simple Moving Average (SMA) SMA stands for the Simple Moving Average known as Moving Average in general which just calculates an average of the price over the given period. Traders Mantra 31
You can use SMA (Simple Moving Average) to find trends. Most use any combination of moving average, which suits you. Most traders use 50 or 100 or 200-period moving average on 4H and 1D TF (Time Frame) for trend direction. Few traders use Moving Average crossovers to enter and exit the trade and price often bounces from MA (Moving Average) line. As you see it’s an uptrend and knowing the bigger TF (Time Frame) trend and entry/exits in smaller TF will have some good traders. Also, if you missed any trade then you can enter while the price is bouncing/ respecting with an MA (Moving Average). Exponential Moving Average (EMA) Exponential Moving Average (EMA) is widely used by the trader and better than SMA (Simple Moving Average) because it gives more weightage to recent price by using the most recent data of price. The calculation is a little bit different in it. Traders Mantra 32
Weighted Moving Average Golden Crossover When a short period MA (Moving Average, can be SMA or EMA) breaks above, then a longer period Moving Average is known as Golden Crossover. Traders usually see it as a long-term uptrend. Moving Average can be 50, 100 or 100, 200 or 50, 200. Traders Mantra 33
oDeath Crossover It’s just the opposite of Golden Crossover, it gives an indication of a potential long-term downtrend. Values are the same as Golden crossover has. False crossover may come because the indicator is lagging. What is the Bollinger Band? Introduced by John Bollinger in the 1980s, Bollinger Bands (BB) is perhaps one of the most useful technical analysis indicators. BB is used to determine overbought and oversold levels, where a trader will try to sell when the price reaches the top of the band and will execute a buy when the price reaches the bottom of the band. Traders Mantra 34
The BB has 3 components: oThe middle line which is The 20 day simple moving average of the closing prices oAn upper band – this is the +2 standard deviation of the middle line oA lower band – this is the -2 standard deviation of the middle line Bollinger Band is a volatility band that is based on the standard deviation. The band expands or deflate with the increases and decreases in volatility. Price is wrapped with 3 SMA (Simple Moving Averages), usually known as Upper Band, Lower Band, and Middle Band. Traders use their own trade style to trade with this. Default BB (Bollinger Band) value of an indicator in 20. Traders Mantra 35
What is Fibonacci Retracement? The topic of Fibonacci retracements is quite intriguing. To fully understand and appreciate the concept of Fibonacci retracements, one must understand the Fibonacci series. The origins of the Fibonacci series can be traced back to the ancient Indian mathematic scripts, with some claims dating back to 200 BC. However, in the 12th century, Leonardo Pisano Bogollo, an Italian mathematician from Pisa, known to his friends as Fibonacci discovered Fibonacci numbers. The Fibonacci series is a sequence of numbers starting from zero arranged so that the value of any number in the series is the sum of the previous two numbers. The Fibonacci sequence is as follows: 0 , 1, 1, 2, 3, 5, 8, 13, 21, 34, 55, 89, 144, 233, 377, 610… Notice the following: 233 = 144 + 89 144 = 89 + 55 89 = 55 +34 Needless to say, the series extends to infinity. There are few interesting properties of the Fibonacci series. Divide any number in the series by the previous number; the ratio is always approximately 1.618. For example: 610/377 = 1.618 377/233 = 1.618 233/144 = 1.618 The ratio of 1.618 is considered as the Golden Ratio, also referred to as the Phi. Fibonacci numbers have their connection to nature. The ratio can be found in the human face, flower petals, animal bodies, fruits, vegetables, rock formation, galaxy formations etc. Of course, let us not get into this discussion as we would be digressing from the main topic. For those interested, I would suggest you search on the internet for golden ratio examples, and you will be pleasantly surprised. Further into the ratio properties, one can find remarkable consistency when a number is in the Fibonacci series is divided by its immediate succeeding number. For example: 89/144 = 0.618 144/233 = 0.618 377/610 = 0.618 At this stage, do bear in mind that 0.618, when expressed in percentage is 61.8%. Traders Mantra 36
Similar consistency can be found when any number in the Fibonacci series is divided by a number two places higher. For example: 13/34 = 0.382 21/55 = 0.382 34/89 = 0.382 0.382, when expressed in percentage terms, is 38.2% Also, consistency is when a number in the Fibonacci series is divided by a number 3 place higher. For example: 13/55 = 0.236 21/89 = 0.236 34/144 = 0.236 55/233 = 0.236 0.236, when expressed in percentage terms, is 23.6%. It is believed that the Fibonacci ratios, i.e. 61.8%, 38.2%, and 23.6%, finds its application in stock charts. Fibonacci analysis can be applied when there is a noticeable up-move or down- move in prices. Whenever the stock moves either upwards or downwards sharply, it usually tends to retrace back before its next move. For example, if the stock has run up from Rs.50 to Rs.100, it is likely to retrace back to probably Rs.70 before moving Rs.120. ‘The retracement level forecast’ is a technique that can identify upto which level retracement can happen. These retracement levels provide a good opportunity for the traders to enter new positions in the trend direction. The Fibonacci ratios, i.e. 61.8%, 38.2%, and 23.6%, help the trader identify the retracement’s possible extent. The trader can use these levels to position himself for trade. Traders Mantra 37
Have a look at the chart below: VOLUME Volumes indicate how many shares are bought and sold over a given period of time. The more active the share, the higher would be its volume S.No. Price Volume What is the expectation? 01 Increases Increases Bullish 02 Increases Decreases Caution – weak hands buying 03 Decreases Increases Bearish Traders Mantra 38
04 Decreases Decreases Caution – weak hands selling High Volume = Today’s volume > last 20 days average volume Low Volume = Today’s volume < last 20 days average volume Average Volume = Today’s volume = last 20days average volume DOW THEORY The Dow Theory was introduced to the world by Charles H. Dow, who also founded the Dow- Jones financial news service (Wall Street Journal). During his time, he wrote a series of articles starting from the 1900s which in the later years was referred to as ‘The Dow Theory’. Much credit goes to William P Hamilton, who compiled these articles with relevant examples over a period of 27 years. Much has changed since the time of Charles Dow, and hence there are supporters and critics of the Dow Theory. Dow theory principle: The Dow Theory is built on a few beliefs. These are called the Dow Theory tenets. Charles H Dow developed these tenets over the years of his observation on the markets. 9 tenets are considered as the guiding force behind the Dow Theory. Traders Mantra 39
Sl No Tenet What does it mean? The stock market indices discount everything which is known & unknown in the public domain. If a sudden and unexpected event occurs, the stock market indices quickly recalibrate itself to reflect the accurate value Indice everything discounts 01 Overall there are 3 broad market trends. 02 Primary Trend, Secondary Trend, and Minor Trends This is the major trend of the market that lasts from a year to several years. It indicates the broader multiyear direction of the market. While the long term investor is interested in the primary trend, an active trader is interested in all trends. The primary trend could be a primary uptrend or a primary downtrend The Primary Trend 03 These are corrections to the primary trend. Think of this as a minor counter-reaction to the larger movement in the market. Example – corrections in the bull market, rallies & recoveries in the bear market. The counter-trend can last anywhere between a few weeks to several months The Secondary Trend 04 Minor fluctuations Trends/Daily These are daily fluctuations in the market; some traders prefer to call them market noise 05 All Indices must confirm with each other. 06 We cannot confirm a trend based on just one index. For example, the market is bullish only if CNX Nifty, CNX Nifty Midcap, CNX Nifty Smallcap etc. all move in the same upward direction. It Traders Mantra 40
would not be possible to classify markets as bullish, just by the action of CNX Nifty alone The volumes must confirm along with the price. The trend should be supported by volume. The volume must increase as the price rises and should reduce as the price falls in an uptrend. In a downtrend, the volume must increase when the price falls and decrease when the price rises. You could refer chapter 12 for more details on volume Volumes must confirm 07 Sideway markets can Markets may remain sideways (trading between a range) for an 08 substitute markets. be a substitute for a secondary trend secondary extended period. Example:- Reliance Industries between 2010 and 2013 was trading between 860 and 990. The sideways markets can Between the open, high, low and close prices, the close is the most important price level as it represents the final evaluation of the stock during the day. The closing price is the most sacred. 09 MARKET PHASES Dow Theory suggests the markets are made up of three distinct phases, which are self- repeating. These are called the Accumulation phase, the Markup phase, and the Distribution phase. The Accumulation phase usually occurs right after a steep sell-off in the market. The steep sell- off in the markets would have frustrated many market participants, losing hope of any uptrend in prices. The stock prices would have plummeted to rock bottom valuations, but the buyers would still be hesitant to buy fearing another sell-off. Hence the stock price languishes at low levels. This is when the ‘SmartMoney’ enters the market. Traders Mantra 41
Smart money is usually the institutional investors who invest in a long term perspective. They invariably seek value investments which are available after a steep sell-off. Institutional investors start to acquire shares regularly, in large quantities over an extended period of time. This is what makes up an accumulation phase. This also means that the sellers trying to sell during the accumulation phase will easily find buyers, and therefore the prices do not decline further. Hence invariably, the accumulation phase marks the bottom of the markets. More often than not, this is how the support levels are created. Accumulation phase can last up to several months. Once the institutional investors (smart money) absorb all the available stocks, short term traders since the support. This usually coincides with the improved business sentiment. These factors tend to take the stock price higher. This is called the markup phase. During the Markup phase, the stock price rallies quickly and sharply. The most important feature of the markup phase is speed. Because the rally is quick, the public at large is left out of the rally. New investors are mesmerized by the return, and everyone from the analysts to the public sees higher levels ahead. Finally, when the stock price reaches new highs (52 weeks high, all-time high), everyone around would be talking about the stock market. The news reports turn optimistic, business environment suddenly appears vibrant, and everyone (public) wants to invest in the markets. By and large, the public wants to get involved in the markets as there is a positive sentiment. This is when the distribution phase occurs. The judicious investors (smart investors) who got in early (during the accumulation phase) will start offloading their shares slowly. The public will absorb all the volumes offloaded by the institutional investors (smart money) there by giving them the well-needed price support. The distribution phase has similar price properties as that of the accumulation phase. Whenever the prices attempt to go higher in the distribution phase, the smart money offloads their holdings. Over a period of time, this action repeats several times, and thus the resistance level is created. Finally, when the institutional investors (smart money) completely sell off their holdings, there would no further support for prices. Hence, what follows after the distribution phase is a complete sell-off in the markets, also known as the mark down of prices. The selloff in the market leaves the public in an utter state of frustration. Completing the circle, what follows the selloff phase is a fresh round of accumulation phase, and the whole cycle repeats. It is believed that that entire cycle from the accumulation phase to the selloff spans over a few years. It is important to note that no two market cycles are the same. For example, in the Indian context, the bull market of 2006 – 07 is way different from the bull market of 2013-14. Sometimes the market moves from the accumulation to the distribution phase over a prolonged multi-year period. On the other hand, the same move from the accumulation to the distribution can happen over a few months. The market participant needs to tune himself to evaluating Traders Mantra 42
markets in the context of different phases, as this sets a stage for developing a view on the market. THE DOW PATTERN Like in candlesticks, there are few important patterns in Dow Theory as well. The trader can use these patterns to identify trading opportunities. Some of the patterns that we will study are: oThe Double bottom & Double top formation oThe Triple Bottom & Triple Top oRange formation, and oFlag formation The support and resistance is also a core concept for the Dow Theory. THE DOUBLE BOTTOM & DOUBLE TOP FORMATION: A double top & double bottom is considered a reversal pattern. A double bottom occurs when a stock’s price hits a shallow price level and rebounds back with a quick recovery. Following the price recovery, the stock trades at a higher level (relative to the low price) for at least 2 weeks (well spaced in time). After which the stock attempts to hit back to the low price previously made. If the stock holds up once again and rebounds, then a double bottom is formed. A double bottom formation is considered bullish, and hence one should look at buying opportunities. Flag formations: The flag formation usually occurs when the stock posts a sustained rally with almost a vertical or a steep increase in stock prices. Flag patterns are marked by a big move which is followed by a short correction. In the correction phase, the price would generally move within two parallel lines. Flag pattern takes the shape of a parallelogram or a rectangle, and they have the appearance of a flag on the pole. Traders Mantra 43
oThe double top oA double top is a bearish technical reversal pattern. oIt is not as easy to spot as one would think because there needs to be a confirmation with a break below support. Traders Mantra 44
The double bottom oThe double bottom looks like the letter "W". The twice-touched low is considered a support level. oThe advance of the first bottom should be a drop of 10% to 20%, then the second bottom should form within 3% to 4% of the previous low, and volume on the ensuing advance should increase. oThe double bottom pattern always follows a major or minor downtrend in a particular security, and signals the reversal and the beginning of a potential uptrend. Head and shoulder pattern: A head and shoulders pattern is a technical indicator with a chart pattern described by three peaks, the outside two are close in height and the middle is highest. A head and shoulders pattern describes a specific chart formation that predicts a bullish- to-bearish trend reversal. The head and shoulders pattern is believed to be one of the most reliable trend reversal patterns. Traders Mantra 45
Inverted head and shoulder pattern:- An inverse head and shoulders is similar to the standard head and shoulders pattern, but inverted: with the head and shoulders top used to predict reversals in downtrends An inverse head and shoulders pattern, upon completion, signals a bull market Investors typically enter into a long position when the price rises above the resistance of the neckline. Traders Mantra 46
Cup with handle:- A cup and handle is a technical chart pattern that resembles a cup and handle where the cup is in the shape of a "u" and the handle has a slight downward drift. A cup and handle is considered a bullish signal extending an uptrend, and is used to spot opportunities to go long. Technical traders using this indicator should place a stop buy order slightly above the upper trendline of the handle part of the pattern. Reward to Risk Ratio (RRR) The concept of reward to risk ratio (RRR) is generic and not really specific to Dow Theory. It would have been apt to discuss this under ‘trading systems and Risk management’. However, RRR finds its application across every trading type, be it trades based on technical analysis or investments through fundamentals. For this reason, we will discuss the concept of RRR here. The calculation of the reward to risk ratio is straightforward. Look at the details of this short term long trade: Entry: 55.75 Stop loss: 53.55 Expected target: 57.20 On the face of it, considering it is a short term trade, the trade looks alright. However, let us inspect this further: Traders Mantra 47
What is the risk the trader is taking? – [Entry – Stoploss] i.e 55.75 – 53.55 = 2.2 What is the reward the trader is expecting? – [Exit – Entry] i.e 57.2 – 55.75 = 1.45 This means for a reward of 1.45 points the trader is risking 2.2 points or in other words, the Reward to Risk ratio is 1.45/2.2 = 0.65. Clearly, this is not a great trade. A good trade should be characterised by a rich RRR. In other words, for every Rs.1/- you risk on trade your expected return should be at least Rs.1.3/- or higher. Otherwise, it is simply not worth the risk. For example, consider this long trade: Entry: 107 Stop loss: 102 Expected target: 114 In this trade, the trader is risking Rs.5/- (107 – 102) for an expected reward of Rs.7/- (114 – 107). RRR, in this case, is 7/5 = 1.4. This means for every Rs.1/- of risk, the trader is assuming, he is expecting Rs.1.4 as a reward. Not a bad deal. The minimum RRR threshold should be set by each trader based on his/her risk appetite. For instance, personally, I wouldn’t say I like to take up trades with a RRR of less than 1.5. Some aggressive traders don’t mind a RRR of 1, meaning for every Rs.1 they risk they expect a reward of Rs.1. Some would prefer the RRR to be at least 1.25. Ultra-cautious traders would prefer their RRR to be upwards of 2, meaning for every Rs.1/- of risk they would expect at least Rs.2 as a reward. A trade must qualify the trader’s RRR requirement. Remember, a low RRR is just not worth the trade. Ultimately if RRR is not satisfied, then even a trade that looks attractive must be dropped as it is just not worth the risk. To give you a perspective think about this hypothetical situation: A bearish engulfing pattern has been formed, right at the top end of a trade. The point at which the bearish engulfing pattern has formed also marks a double top formation. The volumes are beautiful as they are at least 30% more than the 10-day average volumes. Near the bearish engulfing patterns high, the chart is showing medium-term support. In the above situation, everything seems perfectly aligned with a short trade. Assume the trade details are as below: Entry: 765.67 Stop loss: 772.85 Target: 758.5 Risk: 7.18 (772.85 – 765.67) i.e [Stoploss – Entry] Reward: 7.17 (765.67 – 758.5) i.e [Entry – Exit] RRR: 7.17/7.18 = ~ 1.0 Traders Mantra 48
As I mentioned earlier, I do have a stringent RRR requirement of at least 1.5. For this reason, even though the trade above looks great, I would be happy to drop it and move on to scout the next opportunity. Things to do before entering : The stock should form a recognisable candlestick pattern. S&R should confirm to the trade. The stoploss price should be around S&R. -For a long trade, the low of the pattern should be around the support. -For a short trade, the high of the pattern should be around the resistance. Volumes should confirm -Ensure above average volumes on both buy and sell day -Low volumes are not encouraging, and hence do feel free to hesitate while taking trade where the volumes are low. Look at the trade from the Dow Theory perspective. -Primary, secondary trends -Double, triple, range formations -Recognisable Dow formation Indicators should confirm -Scale the trade size higher if indicators confirm to your plan of action -If the indicators do not confirm go ahead with the original plan RRR should be satisfactory -Think about your risk appetite and identify your RRR threshold -For a complete beginner, I would suggest the RRR be as high as possible as this provides a margin of safety. -For an active trader, I would suggest a RRR of at least 1.5 Traders Mantra 49