Download

1 / 5
60 likes | 96 Views
A stock market is the aggregation of potential sellers and buyers(usually a network of economic transactions, not a discrete entity) of stocks (shares). It represent the ownership claims on businesses.

E N D
Top 5 Technical Analysis Tools For the Stock Market By:- Smart Money Gains
Introduction A stock market is the aggregation of potential sellers and buyers(usually a network of economic transactions, not a discrete entity) of stocks (shares). It represent the ownership claims on businesses. Moreover, it include securities stock that is only traded privately as well as listed on a public stock exchange. Stock Market Today has become one of the most popular ways to grow wealth.
Top 5 Technical Analysis Tools For the Stock Market Stock Market Today has become an in-thing for all the potential investors to grow their wealth. Here is the list of top- stock market analysis tools. 1.Stock Charts
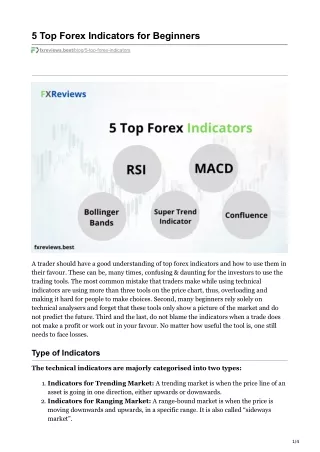
2.Simple Moving Average (SMA): It helps in getting the trend direction since it is commonly used to smooth price data as well as technical indicators. 3. Moving Average Convergence and Divergence (MACD): This tool is used to spot moving averages representing a new or changing trend. 4. Relative Strength Index (RSI): This tool measures the magnitude of latest price changes to assess oversold or over purchased conditions in the price of an asset or other shares. 5. Parabolic SAR: The parabolic SAR is an indicator used to decide the price direction of a share or an asset.
Contact US To invest in the stock market today is not easy as it seems. You have to be aware of all the changing trends of the stock market to make the right decision.If you want to be updated with the Latest Stock Market News, head toward Smart Money Gains. Smart Money Gains is a leading digital publication dedicated to providing the latest financial and business news. To know more visit our website www.smartmoneygains.com now!