State and Regional Migration Patterns
State and Regional Migration Patterns. Presented to the R2PC Executive Committee April 12, 2012. Migration Data Based on a Sample. Census Bureau has been collecting data on migratory patterns since 1940 Migration data released March 28 as part of American Community Survey (ACS)


State and Regional Migration Patterns
E N D
Presentation Transcript
State and Regional Migration Patterns Presented to the R2PC Executive Committee April 12, 2012
Migration Data Based on a Sample • Census Bureau has been collecting data on migratory patterns since 1940 • Migration data released March 28 as part of American Community Survey (ACS) • First release of migration data since 2000 • ACS Data collected on a rolling annual average
Migration Question from ACS • Question from ACS: “Where did this person live 1 year ago. • Respondents provide full address. • Sample gathered over five years.
Michigan Out-Migration vs. In-Migration, 2005-2009 • In-Migration – 128,400 • Out-Migration – 206,600 • Difference – 78,200 net loss
Top 10 Sources of In-Migration to Michigan, 2005-2009 • Florida – 13,300 • Ohio – 13,259 • Illinois – 11,150 • California – 7,828 • Indiana – 7,461 • Texas – 6,739 • New York – 4,887 • Wisconsin – 4,864 • North Carolina – 3,700 • Georgia – 3,520
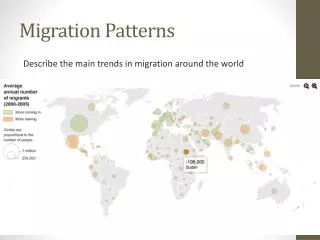
Destination of Departing Michigan Residents by US Region, 2005-2009
Top 10 Destinations of Departing Michiganders, 2005-2009 • Florida – 23,645 • Ohio – 16,213 • Illinois – 13,742 • Texas – 13,144 • Indiana – 12,089 • California – 11,764 • Arizona – 10,826 • North Carolina – 7,829 • Georgia – 7,556 • Tennessee – 6,404
Net In-Migration • Alaska - 805 • Connecticut – 439 • Vermont - 144 • New Hampshire – 9 • Rhode Island - 9
Summary • Michigan has had a net outflow of population since 1998-99 • Still losing population due to negative out-migration, but significant improvement since 2007-2008 • Dependent on economic conditions the automobile industry • Out-migration peaks in mid-1970’s, early 1980’s (worst), and since 2000.
County Population Estimates, 2011 • Estimates released April, 2012 by Census Bureau • Components of population change include: • Natural increase/decrease (births minus deaths) • Net international migration (immigrants, emigrants, military personnel) • Net domestic migration
Components of Hillsdale County Population Change, 2010-2011 • Estimated population, July, 2010 – 46,626 • Natural increase (births minus deaths) – 73 • Net international migration – 27 • Net domestic migration – (208) • ESTIMATED POPULATION, July, 2011 – 46,518
Components of Jackson County Population Change, 2010-2011 • Estimated population, July, 2010 – 160,168 • Natural increase (births minus deaths) – 319 • Net international migration – 72 • Net domestic migration – (815) • ESTIMATED POPULATION, July, 2011 – 159,744
Components of Lenawee County Population Change, 2010-2011 • Estimated population, July, 2010 – 99,762 • Natural increase (births minus deaths) – 116 • Net international migration – 83 • Net domestic migration – (524) • ESTIMATED POPULATION, July, 2011 – 99,437
Components of RegionalPopulation Change, 2010-2011 • Estimated population, July, 2010 – 306,556 • Natural increase (births minus deaths) – 508 • Net international migration – 182 • Net domestic migration – (1,547) • ESTIMATED POPULATION, July, 2011 – 305,669
For further information Timothy Anderson, AICP, Principal Planner (517) 768-6703 tanderso@co.jackson.mi.us Web sites of interest: American Community Survey http://www.census.gov/acs/www/index.html Michigan Census http://www.michigan.gov/cgi/ US Census Bureau http://www.census.gov/