Download
1 / 15
160 likes | 280 Views
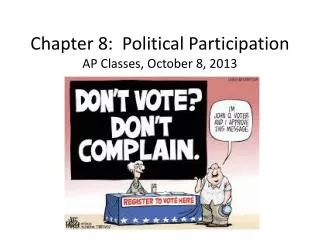
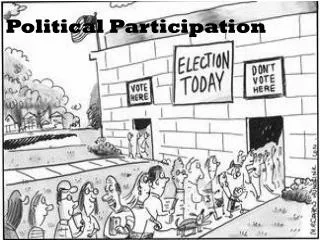
Chapter 8- Political Participation. I. A Closer Look at Nonvoting. The Problem of Nonvoting and its Sources 1. Misleading statistics and different measures Election Results: (same election) Turnout- 51% 87% 3. What is the real problem with voter turnout?

E N D
I. A Closer Look at Nonvoting • The Problem of Nonvoting and its Sources 1. Misleading statistics and different measures Election Results: (same election) Turnout- 51% 87% 3. What is the real problem with voter turnout? a. apathy is not the problem
4. Solution to the problem? a. burden of registration b. Motor Voter Law: (NVRA) 1. DMV 2. State offices 3. By mail
B. The Rise of the American Electorate 1. 5 stages of electorate growth: a. b. c.
d. 1960s 1. 2. 3.
e. 1. National standards now govern almost every aspect of voter eligibility
2. Voter Turnout- despite increase in size of potential voting population, turnout remains steady a. 1860-1900 Pres. Elections compared to those since 1900 1. Decline in popular interest; weakening of competitiveness 2. Decline not real,but apparent- HOW?
b. “vote early, vote often” c. Australian Ballot: d. strict voter-registration procedures had intended/unintended consequences
C. Who Participates in Politics? 1. Forms of participation: a. higher proportions take part in nonpolitical than political activities b. six forms of participation: 1. Inactives (22%) 2. Voting specialist-
3. Campaigners- 4. Communalists- 5. Parochial participants 6. Activists- participate in all forms
2. The Causes of Participation a. education; occupation; income b. religion c. men and women d. race
3. Demographic changes can explain decline in turnout- younger; growth of African American population 4. What about schooling? 5. Difficulty of registering has been made easier
6. Other things: a. youthfulness of population b. effectiveness of political party c. remaining registration difficulty 7. Number of reasons why we register and vote less frequently = party strength, automatic registration, and voting laws
D. Meaning of Participation Rates 1. 1967-1987: voting % dropped, but other forms went up a. campaigning, contacting officials, community issues b. public demonstrations 2. Number of elected offices is huge = less importance