Download
1 / 11
110 likes | 271 Views
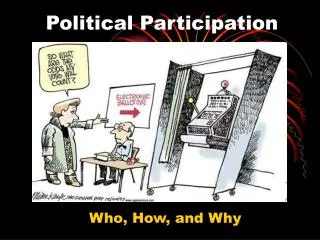
Political Participation. Who, How, and Why. In pairs, answer the following questions…. 1. Should Americans be forced to vote? 2. Should Washington D.C. be granted a seat in the House of Representatives?

E N D
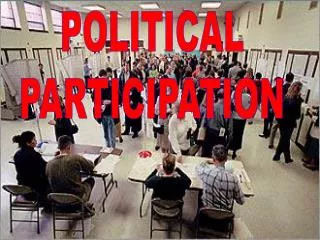
Political Participation Who, How, and Why
In pairs, answer the following questions… • 1. Should Americans be forced to vote? • 2. Should Washington D.C. be granted a seat in the House of Representatives? • 3. How much of an impact has the expansion of the voting franchise really had on elections? • 4. How much of an impact would absent voters really have on the outcome of an election? • 5. Is it better to cast an ill-informed ballot or not to vote at all?
Changing Electorate • States had initial control over voting • Gradually the federal gov’t has reduced state control in favor of civil rights (15th, 19th, 23rd, 26th)
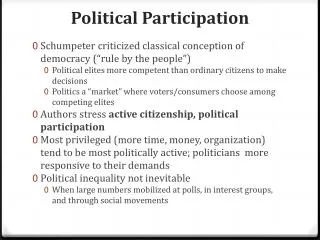
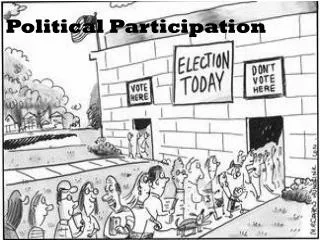
Is Participation a Problem in the US? • If we look at eligible populations… • If we look at registered voters… • Why aren’t people registered? • Costly (really?) • Apathetic? • Satisfied with the way things are? • Alienated? • How to get more people registered? • Get out the vote campaigns • Motor voter (‘93) • Vote or Die Campaign
Who Is More Likely to Participate? • Indicators: -Education – college educated more likely -Religious involvement – social connectedness, clarifies issues -Color/Ethnicity – white tend to vote more than blacks (except when accounting for income and education…hmmm?) Latinos less likely -Age – older people more likely to vote -Occupation – professionals more likely -Income – higher income more likely
Likely Voters • Education • more • Income • more $ • Age • older • Gender • women • Religion • Catholics & Jews • Race • White • Except when education and income are taken into account
Is Participation a Problem in the US? • Is voting the only measure of participation? • Civic organizations, letter writing • Campaign activities, lobbying, following politics • Activism – protests, movements • In Western Europe… • Voters automatically registered • Only vote for a member of Parliament
In pairs… • Design a campaign to boost voter turnout. • Be specific with how you will implement your plan (and be ready to defend it). • Present it in 3-5 simple steps.
Voter Turn-out • Is the decline real or is it just now more apparent? • Real Decline -Difficulty of registration (same day?, universal?) -No ballot uniformity across the nation -Declining interest -Diminished party competitiveness (participation) -More honest process (parties) (Australian ballot) • We don’t count this very well (VAP & VEP)
Voting Issues • Do candidates send clear messages? • Policy mandate • Are voters informed? • Prospective voting – looking to the future, voting for candidate/issue that matches your beliefs • Retrospective voting – supporting or opposing a candidate based upon what they have done in office (economic)
How Do Americans Participate? • Forms of participation • Voting (50-60%) • 22% inactive (young, little education, low income) • 11% are activists (middle-aged, highly educated, higher income) • Contributing • Political organizations, non-political organizations, religious charity work, other charitable work