Climate Influence on Planetary Wave Amplitude and California Fish Landings (1948-2008)
This study examines the climatology and anomalies of planetary wave amplitudes (waves 1-3) during distinct solar activity regimes from 1948 to 2008. It highlights the impact of solar maximum and minimum anomalies on climate patterns, particularly focusing on the relationship between these shifts and California fish landings. Key findings include the identification of significant regime-shift periods and their correspondence with wave amplitude changes, illustrating how climate dynamics affect marine ecosystems and fisheries in the context of historical solar activity.

Climate Influence on Planetary Wave Amplitude and California Fish Landings (1948-2008)
E N D
Presentation Transcript
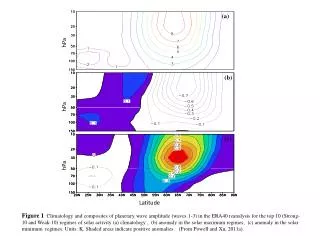
(a) hPa (b) hPa (c) hPa Latitude Figure 1Climatology and composites of planetary wave amplitude (waves 1-3) in the ERA40 reanalysis for the top 10 (Strong-10 and Weak-10) regimesof solar activity (a) climatology , (b) anomaly in the solar maximum regimes, (c) anomaly in the solar minimum regimes. Units: K. Shaded areas indicate positive anomalies. (From Powell and Xu, 2011a).
(a) (b) FIG. 2 Normalized F10.7cm Radio Flux (lines with circles) and the Regime Shift Index (solid straight lines). a) Normalized F10.7 annual solar radio flux from 1948-2008 with identified regime shift periods and approximate shift dates: 1961-62, 1977-78, 1993-94. b) Regime shift index based on the student t-test from 1948-2008. Dashed line indicates the significant test at the 90% confidence level. Note correspondence at 1961-62, and 1977-78 with lesser correspondence at 1992-93.
(a) (b) FIG. 3 Normalized Planetary Wave Amplitude Index (PWAI) and The Regime Shift Index. a) Normalized planetary wave amplitude index (PWAI) from 1948-2008 for 55-75N, and 70-20 hPa with identified regime shift periods and approximate shift dates (1964-65, 1977-78, 1989-90 and 1999-2000). b) Regime shift index based on the student t-test from 1948-2008. Dashed line indicates the significant test at the 90% confidence level. Note the correspondence at 1977-78, 1964-65 and 1989-90 with possible correspondence at 1997-78.
(a) (b) FIG. 4 Normalized California Fish Landings and the Regime Shift index. a) Normalized California’s fish landings from 1948-2008 for total amounts of the 31 fish species with identified regime shift periods and approximate shift dates. b) Regime shift index based on the student t-test from 1948-2008. Dashed line indicates the significant test at the 99% confidence level.
FIG.5 Reconstructed Global Wave Amplitude Anomalies from the Height Fields for Planetary Wavenumbers 1-6 with Altitude (Pressure Level). Left Panel: 1965-1977; right panel : 1978-88. (Negative anomaly : Blue-purple shading; Positive anomaly : Green-yellow-red)
(a) (b) (c) (d) (e) (f) (g) (h) FIG.6 Reconstructed Anomalies and Ecosystem Changes. Reconstructed height and wind field anomaly at 1000hPa model level for the planetary wave number 1 ~ 6 . (a) and (b) Global wave pattern anomalies at the surface; (c ) and (d) North and Central Pacific. Shaded areas indicate the planetary wave anomaly in height field ( Blue-purple shading : negative anomaly; green-yellow-red : positive anomaly); (e) and (f) Sea Surface Temperature anomaly. (g) and (h) Fishery species change across the regime shift. Left Panel: 1965-1977; right panel : 1978-88.
Pattern prior to 1977 Warm Cold Pattern after 1978 Cold Warm FIG7. Schematic Diagrams of the Forcing Mechanism. Schematic diagrams of the planetary wave wind field patterns leading to opposing warm and cool anomalies that affect the major ecosystems fish catch and stock numbers.WARMecosystemregimeshave generally positive impacts on fish catch/stock and the COOL regimes have generally negative impacts. The “arrow” indicates the surface wind flow direction over the Pacific ocean. (note the fish in the boxes only represent the change in the species performing better or worse and may not be indicative of the actual species in the ecosystem addressed).
Table 1. Fish Species List for the California Ecosystem There are 32 categories of fish species including the ‘All’ (Number 1) category which is a composite of the 31 fish species total fish landings. Simple species type definitions: Pelagic: Upper oceanic big fish Forage: Upper oceanic small fish Demersal: Lower oceanic fish. Climate regimes shifts detected in each species landing history are shown.