Download
1 / 1
10 likes | 116 Views
The influence of MJO on Climate Variability in southeastern South America. Mariano S. Alvarez, Carolina S. Vera C entro de Investigaciones del Mar y la Atmósfera/CONICET-UBA , DCAO/FCEN, UMI-IFAECI/CNRS . Buenos Aires, Argentina alvarez@cima.fcen.uba.ar.

E N D
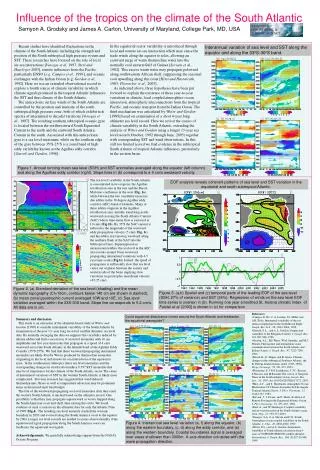
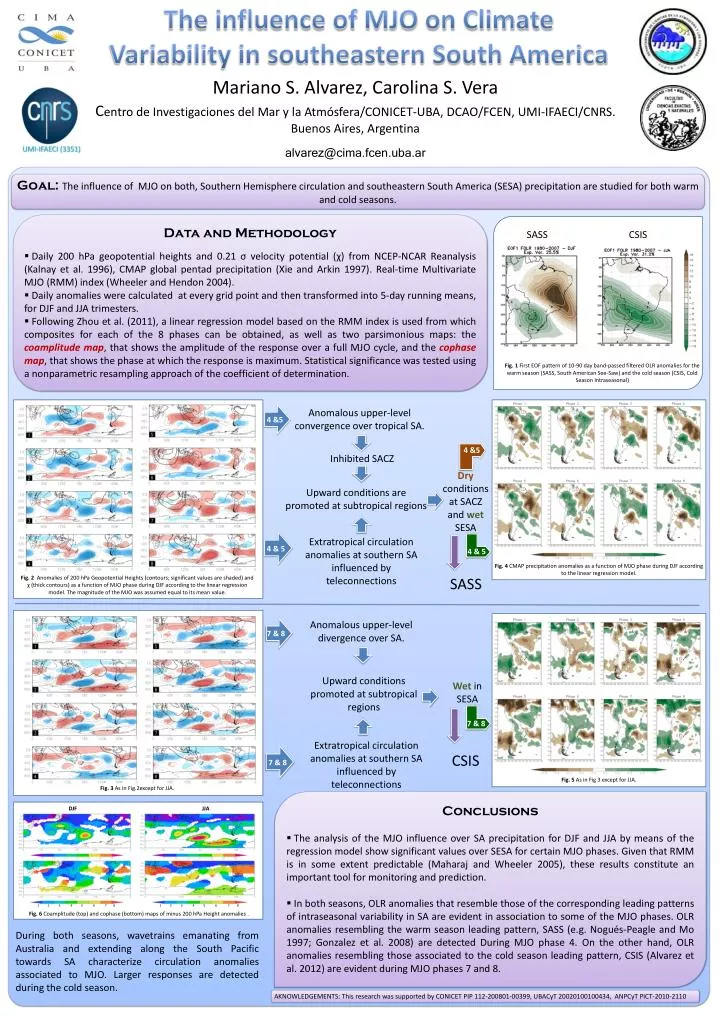
The influence of MJO on Climate Variability in southeastern South America Mariano S. Alvarez, Carolina S. Vera Centro de Investigaciones del Mar y la Atmósfera/CONICET-UBA, DCAO/FCEN, UMI-IFAECI/CNRS. Buenos Aires, Argentina alvarez@cima.fcen.uba.ar Goal: The influence of MJO on both, Southern Hemisphere circulation and southeastern South America (SESA) precipitation are studied for both warm and cold seasons. • Data and Methodology • Daily 200 hPa geopotential heights and 0.21 σ velocity potential (χ) from NCEP-NCAR Reanalysis (Kalnay et al. 1996), CMAP global pentad precipitation (Xie and Arkin 1997). Real-time Multivariate MJO (RMM) index (Wheeler and Hendon 2004). • Daily anomalies were calculated at every grid point and then transformed into 5-day running means, for DJF and JJA trimesters. • Following Zhou et al. (2011), a linear regression model based on the RMM index is used from which composites for each of the 8 phases can be obtained, as well as two parsimonious maps: the coamplitude map, that shows the amplitude of the response over a full MJO cycle, and the cophase map, that shows the phase at which the response is maximum. Statistical significance was tested using a nonparametric resampling approach of the coefficient of determination. SASS CSIS Fig. 1 First EOF pattern of 10-90 day band-passed filtered OLR anomalies for the warm season (SASS, South American See-Saw) and the cold season (CSIS, Cold Season Intraseasonal) Anomalous upper-level convergence over tropical SA. 4 &5 4 &5 Inhibited SACZ Dry conditions at SACZ and wetSESA Upward conditions are promoted at subtropical regions Extratropical circulation anomalies at southern SA influenced by teleconnections 4 & 5 4 & 5 Fig. 4CMAP precipitation anomalies as a function of MJO phase during DJF according to the linear regression model. Fig. 2 Anomalies of 200 hPa Geopotential Heights (contours; significant values are shaded) and χ(thick contours) as a function of MJO phase during DJF according to the linear regression model. The magnitude of the MJO was assumed equal to its mean value. SASS Anomalous upper-level divergence over SA. 7 & 8 Upward conditions promoted at subtropical regions Wet in SESA 7 & 8 Extratropical circulation anomalies at southern SA influenced by teleconnections CSIS 7 & 8 Fig. 5As in Fig 3 except for JJA. Fig. 3 As in Fig.2except for JJA. • Conclusions • The analysis of the MJO influence over SA precipitation for DJF and JJA by means of the regression model show significant values over SESA for certain MJO phases. Given that RMM is in some extent predictable (Maharaj and Wheeler 2005), these results constitute an important tool for monitoring and prediction. • In both seasons, OLR anomalies that resemble those of the corresponding leading patterns of intraseasonal variability in SA are evident in association to some of the MJO phases. OLR anomalies resembling the warm season leading pattern, SASS (e.g. Nogués-Peagle and Mo 1997; Gonzalez et al. 2008) are detected During MJO phase 4. On the other hand, OLR anomalies resembling those associated to the cold season leading pattern, CSIS (Alvarez et al. 2012) are evident during MJO phases 7 and 8. DJF JJA 1 2 3 4 5 6 7 8 1 2 3 4 5 6 7 8 Fig. 6 Coamplitude (top) and cophase (bottom) maps of minus 200 hPa Height anomalies . During both seasons, wavetrains emanating from Australia and extending along the South Pacific towards SA characterize circulation anomalies associated to MJO. Larger responses are detected during the cold season. AKNOWLEDGEMENTS: This research was supported by CONICET PIP 112-200801-00399, UBACyT 20020100100434, ANPCyT PICT-2010-2110