Human Population
Human Population. Objectives. Calculate natural percentage population change Identify the types of expected growth from age structure diagrams Use the Demographic Transition Model to evaluate a countries level of development Describe solutions for population stability.

Human Population
E N D
Presentation Transcript
Objectives • Calculate natural percentage population change • Identify the types of expected growth from age structure diagrams • Use the Demographic Transition Model to evaluate a countries level of development • Describe solutions for population stability
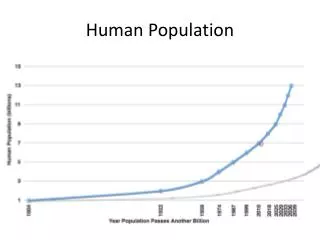
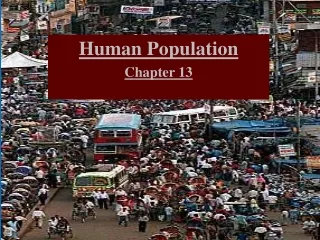
Current World Population: 6.6 billion The human population is now in an exponential part of a J-shaped growth curve. World population increases the equivalent of one medium-sized city (216,000) per day and 79 million per year. Calculate the doubling time for the world at the current growth rate. The world population may level off at 8, 10.5 or 14.2 billion. Why?
Demography: the statistical study of a population • As of the census[2] of 2000, there were 58,974 people, 18,947 households, and 14,020 families residing in the city. The population density was 3,106.4/km² (8,045.8/mi²). There were 19,441 housing units at an average density of 1,024.0/km² (2,652.3/mi²). The racial makeup of the city was 63.00% White, 1.57% Black or African American, 0.96% Native American, 5.93% Asian, 0.22% Pacific Islander, 23.66% from other races, and 4.67% from two or more races. 49.04% of the population were Hispanic or Latino of any race. • There are 19,042 households out of which 39.3% had children under the age of 18 living with them, 54.5% were married couples living together, 13.5% had a female householder with no husband present, and 26.0% were non-families. 21.0% of all households were made up of individuals and 8.0% had someone living alone who was 65 years of age or older. The average household size was 3.08 and the average family size was 3.56. • In the city the population was spread out with 29.1% under the age of 18, 10.3% from 18 to 24, 31.7% from 25 to 44, 18.2% from 45 to 64, and 10.8% who were 65 years of age or older. The median age was 31 years. For every 100 females there were 97.1 males. For every 100 females age 18 and over, there were 94.7 males.
Demography :the statistical study of a population Density Distribution Growth rate For a population i.e. La Habra Percent change = ( ) – ( ) For the World population change Crude birth rate = birth rate/1000 people Crude death rate = deaths/1000 people Percent change = birth rate – death rate x 100 1000 persons
Demography :the statistical study of a population Density Distribution Growth rate For a population i.e. La Habra Percent change = (births + immigration) – (deaths + emigration) For the World population change Crude birth rate = birth rate/1000 people Crude death rate = deaths/1000 people Percent change = birth rate – death rate x 100 1000 persons
Factors Affecting Population Size Fertility Rate: Replacement Level Fertility Total fertility rate Mortality rate
Social Security Women’s opportunities in the workforce Contraceptive Access Health Care Education Older Marital Age Old age security Lack of education Women’s status in society Lack of contraception Child mortality MDC vs. LDC
Age Structure Diagrams Postreproductive Reproductive Prereproductive
Growth Rate Designations • Rapid: 1.5 – 3% • Slow: 0.3 – 1.4% • Zero: 0 – 0.2% • Negative
99% of the next billion people added will be born in poor, less developed regions that are least able to support them 44% of Nigeria’s population is under age 15!
Effects of Population Growth • Where will people live?
Effects of Population Growth • Where will people live? • How will we feed, house and educate?
Effects of Population Growth • Where will people live? • How will we feed, house and educate? • Will we have necessary resources?
Effects of Population Growth • Where will people live? • How will we feed, house and educate? • Will we have necessary resources? • What will the impact on the environment be?
Effects of Population Decline • Loss of work force
Effects of Population Decline • Loss of work force • Loss of persons in reproductive range
Effects of Population Decline • Loss of work force • Loss of persons in reproductive range • Loss of resources for aging population
Population Stability • Demographic Transition Model
Influencing Population Size The Cairo Conference 1997 • Empower women • Education • Health care • Increase economic opportunities
Summary • Demography is the statistical study of
Summary • Demography is the statistical study of populations • provide information for projecting population dynamics
Summary • Demography is the statistical study of populations • Age structure diagrams provide information for projecting population dynamics • The worlds TFR is declining as population is
Summary • Demography is the statistical study of populations • Age structure diagrams provide information for projecting population dynamics • The worlds TFR is declining as population is increasing • The majority of growth will occur in
Summary • Demography is the statistical study of populations • Age structure diagrams provide information for projecting population dynamics • The worlds TFR is declining as population is increasing • The majority of growth will occur in LDC’s • A naturally occurring equilibrium is supported by the
Summary • Demography is the statistical study of populations • Age structure diagrams provide information for projecting population dynamics • The worlds TFR is declining as population is increasing • The majority of growth will occur in LDC’s • A naturally occurring equilibrium is supported by the Demographic Transition Model • Education, economic stimulus, and empowerment of women are methods of influencing
Summary • Demography is the statistical study of populations • Age structure diagrams provide information for projecting population dynamics • The worlds TFR is declining as population is increasing • The majority of growth will occur in LDC’s • A naturally occurring equilibrium is supported by the Demographic Transition Model • Education, economic stimulus, and empowerment of women are methods of influencing population size