“Probability”
“Probability”. Tree Diagram. Experiment: Select 2 Red 4 Yellow Tickets without replacement. Dependent!. R. P(both are Red)=(2/6)(1/5) =1/15. 1/5. R. 2/6. P(First is Red & Second is yellow)=(2/6)(4/5) =4/15. Y. 4/5. R. 4/5. P(First is Yellow & Second is Red)=(4/6)(4/5) =16/30. 4/6.

“Probability”
E N D
Presentation Transcript
Tree Diagram Experiment: Select 2 Red 4 Yellow Tickets without replacement. Dependent! R P(both are Red)=(2/6)(1/5) =1/15 1/5 R 2/6 P(First is Red & Second is yellow)=(2/6)(4/5) =4/15 Y 4/5 R 4/5 P(First is Yellow & Second is Red)=(4/6)(4/5) =16/30 4/6 Y 3/5 Y P(Both red)=(4/6)(3/5) =12/30
Tree Diagram Experiment: Select 2 Red 4 Yellow Tickets with replacement. Dependent! R P(both are Red)=(2/6)(1/5) =1/15 1/5 R 2/6 P(First is Red & Second is yellow)=(2/6)(4/5) =4/15 Y 4/5 R 4/5 P(First is Yellow & Second is Red)=(4/6)(4/5) =16/30 4/6 Y 3/5 Y P(Both red)=(4/6)(3/5) =12/30
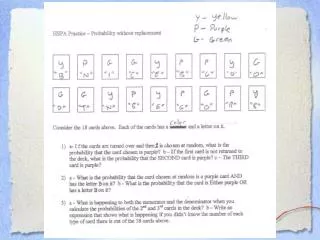
Dependent! R P(both are Red)=(7/10)(6/9) =7/15 6/9 R 7/10 P(First is Red & Second is Green)=(7/10)(3/9) =7/30 G 3/9 R 7/9 P(First is Green & Second is Red)=(3/10)(7/9) =7/30 3/10 G 2/9 G P(Both Green)=(3/10)(2/9) =1/15 Y
Tree Diagram Experiment: Select 2 pens from 20 pens: 14 blue & 6 red. Don’t replace. Dependent! R P(RR)=(6/20)(5/19) =3/38 5/19 R 6/20 B 14/19 P(RB)=(6/20)(14/19) =21/95 R P(BR)=(14/20)(6/19) =21/95 6/19 14/20 B 13/19 B P(BB)=(14/20)(13/19) =91/190
Practice Problems • A card is drawn from a deck of 10 cards numbered 1 through 10 and a number cube is rolled. Find the probability of each below. • P(10 and 3) 2. P(two even numbers) • 3. P(two numbers less than 4) 7
Practice Problems There are 4 red, 6 green, and 5 yellow pencils in a jar. Once a pencil is selected, it is not replaced. Find the probability of each below. 4. P(red then yellow) 5. P(two green) 6. P(green then yellow) 7. P(red then green) 8
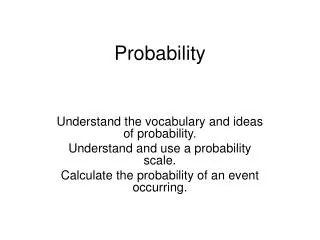
Definitions Probability is the mathematics of chance. It tells us the relative frequency with which we can expect an event to occur The greater the probability the more likely the event will occur. It can be written as a fraction, decimal, percent, or ratio.
1 Certain .5 50/50 0 Impossible Definitions Probability is the numerical measure of the likelihood that the event will occur. Value is between 0 and 1. Sum of the probabilities of all events is 1.
Definitions A probability experiment is an action through which specific results (counts, measurements, or responses) are obtained. The result of a single trial in a probability experiment is an outcome. The set of all possible outcomes of a probability experiment is the sample space, denoted as S. e.g. All 6 faces of a die: S = { 1 , 2 , 3 , 4 , 5 , 6 }
Definitions Other Examples of Sample Spaces may include: Lists Tables Grids Venn Diagrams Tree Diagrams May use a combination of these Where appropriate always display your sample space
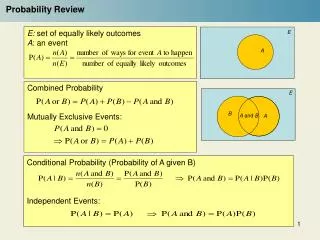
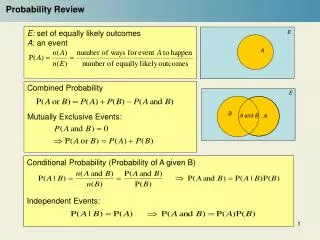
Definitions An event consists of one or more outcomes and is a subset of the sample space. Events are often represented by uppercase letters, such as A, B, or C. Notation: The probability that event E will occur is written P(E) and is read “the probability of event E.”
Number of Event Outcomes P(E) = Total Number of Possible Outcomes in S Definitions • The Probability of an Event, E: • Consider a pair of Dice • Each of the Outcomes in the Sample Space are random • and equally likely to occur. e.g. P( ) = (There are 2 ways to get one 6 and the other 4)
Number of Event Outcomes P(E) = Total Number of Possible Outcomes in S Definitions There are three types of probability 1. Theoretical Probability Theoretical probability is used when each outcome in a sample space is equally likely to occur. The Ultimate probability formula
Number of Event Occurrences P(E) = Total Number of Observations Definitions There are three types of probability 2. Experimental Probability Experimental probability is based upon observations obtained from probability experiments. The experimental probability of an event E is the relative frequency of event E
Definitions There are three types of probability 3. Subjective Probability Subjective probability is a probability measure resulting from intuition, educated guesses, and estimates. Therefore, there is no formula to calculate it. Usually found by consulting an expert.
Definitions Law of Large Numbers. As an experiment is repeated over and over, the experimental probability of an event approaches the theoretical probability of the event. The greater the number of trials the more likely the experimental probability of an event will equal its theoretical probability.
Complimentary Events The complement of event E is the set of all outcomes in a sample space that are not included in event E. The complement of event E is denoted by Properties of Probability:
Sample Space and Events Sample space: The collection of all possible outcomes for an experiment. Event: A collection of outcomes for the experiment, that is, any subset of the sample space.
The event a king is selected 1/13 = 4/52
The event a heart is selected 1/4 = 13/52
The event a face card is selected 3/13=13/52
The event a heart is selected 1/4 = 13/52
Probabilities of Combined events • Dependent and Independent Events A compound event is made up of one or more separate events. To find the probability of a compound event, you need to know if the events are independent or dependent. Events are independent events if the occurrence of one event does not affect the probability of the other. Events are dependent events if the occurrence of one does affect the probability of the other.
Example 1: Classifying Events as Independent or Dependent • Determine if the events are dependent or independent. • A. getting tails on a coin toss and rolling a 6 on a number cube • B. getting 2 red gumballs out of a gumball machine Tossing a coin does not affect rolling a number cube, so the two events are independent. After getting one red gumball out of a gumball machine, the chances for getting the second red gumball have changed, so the two events are dependent.
Independent and Dependent Events 18 12 12 12 12 In each box, P(blue) = . · · = = Course 3 Example: Finding the Probability of Independent Events Three separate boxes each have one blue marble and one green marble. One marble is chosen from each box. What is the probability of choosing a blue marble from each box? The outcome of each choice does not affect the outcome of the other choices, so the choices are independent. Multiply. P(blue, blue, blue) = 0.125
Independent and Dependent Events Course 3 To calculate the probability of two dependent events occurring, do the following: 1. Calculate the probability of the first event. 2. Calculate the probability that the second event would occur if the first event had already occurred. 3. Multiply the probabilities.
Independent and Dependent Events 23 69 = Course 3 Example : Find the Probability of Dependent Events The letters in the word dependent are placed in a box. If two letters are chosen at random, what is the probability that they will both be consonants? Because the first letter is not replaced, the sample space is different for the second letter, so the events are dependent. Find the probability that the first letter chosen is a consonant. P(first consonant) =
Independent and Dependent Events 58 58 23 5 12 · = The probability of choosing two letters that are both consonants is . 5 12 Course 3 Example Continued If the first letter chosen was a consonant, now there would be 5 consonants and a total of 8 letters left in the box. Find the probability that the second letter chosen is a consonant. P(second consonant) = Multiply.
Probability Tree Diagrams The probability of a complex event can be found using a probability tree diagram. 1. Draw the appropriate tree diagram. 2. Assign probabilities to each branch. (Each section sums to 1.) 3. Multiply the probabilities along individual branches to find the probability of the outcome at the end of each branch. 4. Add the probabilities of the relevant outcomes, depending on the event.
Example Example: What is the probability of randomly drawing either an ace or a heart from a deck of 52 playing cards? Note that you can not use our original version of the addition rule here since the events are not disjoint. (It is possible for the card to be both an Ace and a Heart).
Relationships Among Events (not E): The event that “E does not occur.” (A & B): The event that “both A and B occur.” (A or B): The event that “either A or B or both occur.”
Event (not E) where E is the probability of drawing a face card. 40/52=10/13
The Complementation Rule For any event E, P(E) = 1 – P (~ E). In words, the probability that an event occurs equals 1 minus the probability that it does not occur.