Download
1 / 25
250 likes | 364 Views
This project aimed to transform an Introductory Microeconomics course into a learner-centered experience through the use of web-enabled technologies. The comparative study assessed two sections: one traditional and one innovative. The innovative section adopted active learning pedagogy, allowing students to engage in projects, discussions, and peer instruction using technology. The methodology included pre- and post-tests, quizzes, group projects, and interactive learning journals, with results suggesting that computer-mediated, active learning approaches enhance student engagement and performance.

E N D
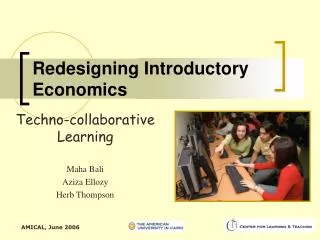
Redesigning Introductory Economics Techno-collaborative Learning Maha Bali Aziza Ellozy Herb Thompson
The context • Changing landscape in teaching and learning • “Teach less, learn more” • Learning technologies allow for innovations, can be powerful learning tools LEARNING
Introduction • Aim of project was to create a learner-centered, formatively assessed course that used web-enabled technology • Introductory Microeconomics chosen to be redesigned • Has many sections and has “broad institutional impact”
Research question • Does computer-mediation, coupled with “active” learning pedagogyenhance student performance or student interest in the learning process?
Commenting on the experiment, Dr Thompson says “The experiment, carried out in conjunction with the Center for Learning and Teaching, compared two classes taught concurrently. In one class I used the “talking head” approach with examinations. In the other class I used the “active learning” approach in which groups of students interactively used computer sites, created projects, did the lecturing and used me as a facilitator to help guide them through the morass of information.”
Commenting on the experiment, Dr Thompson’s says “ Had you walked into the first class you would have probably been as bored as the students. Had you walked into the second you would have probably been astonished by the chaos. Which group of students do you think did better?”
Description and Methodology To gather comparative data: • Two parallel sections: “traditional” and “innovative” were taught: • Same professor • Same semester • Same textbook • Same final exam • Same pre- and post- tests
Material Online Syllabus, topic notes, glossary, ppt slides, learning styles questionnaire, required and additional reading, assignments, calendar, bonus questions, discussion forum. Teaching/learning approaches in each section Syllabus, topic notes, glossary, ppt. slides, learning styles questionnaire, study guide, chapter links to relevant internet material, links to classical scholars in economics, calendar, bonus questions, discussion forum and quizzes. Student group projects and learning journalswere uploaded for viewing by the entire class. Lecture Lectures by instructor with .ppt slides. Students were encouraged to ask questions before and during lectures. Lectures by students using .ppt slides.Student centred, open class participation and interaction encouraged (e.g., peer instruction, group activities collaboration and sharing of computer searches to solve problems or discuss issues) Class Environment One computer, projector and screen for professor Class projector and screen for use by all.Each student supplied with a personal computer. Software (Timbuctu) allowed any of the computers to use projection screen.
Teaching/learning approaches in each section Assignments 2 readings and summary analysis uploaded on WebCT discussion forum Group project; Learning journal uploaded on WebCT Quizzes 2 paper-based pop quizzes, with normal assessment of correct answers. 10 online quizzes – one per week.Following quiz, peers discuss answers. Credit given simply for taking quiz Direct Assessment 2 pop quizzes – 20% Class participation – 20% Midterm – 20% 2 paper-based readings and summary analysis – 20% Final Exam – 20% 10 online quizzes – 10% Class/Web participation – 20% Class project – 30% Learning Journal – 15% Final Exam – 25% Indirect Assessment Pre- and Post-course tests, Student evaluations, a Small Group Instructional Diagnosis, Learning Styles questionnaire, WebCT tracking student activities
Collaboration in Stages • Instructional Design • WebCT Design • Implementation • Formative Assessment • Data analysis • Final Assessment Of course, the instructor was involved throughout
Available Data • Learning Styles Questionnaire • Pre- and Post- test results • Final Exam and final grades • Student course evaluations • Small Group Instructional Diagnosis
Learning Styles Questionnaire1 • Active vs. Reflective learners • Sensory-based vs. Intuitive learners • Visual vs. Verbal learners • Sequential vs. Global learners Results more anecdotal than analytical. Provides room for consideration 1 Felder and Solomon available at http://www.ncsu.edu/felder-public/
Student evaluationsA. Course Evaluation (Mean) of Course on a scale of 1-5 with 1 = Strongly Disagree; 5 = Strongly Agree
Student evaluationsB. Instructor Evaluation (Mean) of Instructor on a scale of 1-5 with 1 = Strongly Disagree; 5 = Strongly Agree
Small Group Instructional Diagnosis: summary • Innovative section: • Students more comfortable with speed of the course, the use of technology, and the material covered. • Traditional section: • Students uncomfortable with the speed of instruction; felt their questions were not sufficiently answered and that the course was not sufficiently interactive.
Small Group Instructional Diagnosis: summary • Innovative section: • Students much more interested in taking more economics courses and/or majoring in economics • Traditional section: • Students showed much less enthusiasm for the material covered, or for economics as a discipline
Conclusions • Insufficient quantitative and qualitative data to allow clear, undifferentiated judgements. • Activity-based alternative vs. “talking head”/ conventional testing • Sufficient evidence to show that the learning process (and economics) enjoyed much more by students when engaged in an open, active, collaborative manner.
Publication • This work has been presented at WEBIST 2006: International Conference on Web Information Systems and Technologies (in Portugal, April 2006) and appears in the refereed conference proceedings
Questions ? Thank You