CART: Classification and Regression Trees
270 likes | 796 Views
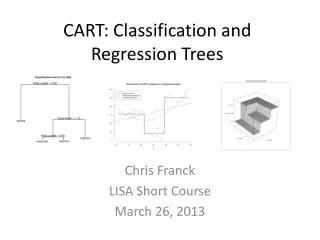
CART: Classification and Regression Trees. Chris Franck LISA Short Course March 26, 2013. Outline. Overview of LISA Overview of CART Classification tree description Examples – iris and skull data. Regression tree description Examples – simulated and car data Going further

CART: Classification and Regression Trees
E N D
Presentation Transcript
CART: Classification and Regression Trees Chris Franck LISA Short Course March 26, 2013
Outline • Overview of LISA • Overview of CART • Classification tree description • Examples – iris and skull data. • Regression tree description • Examples – simulated and car data • Going further • Mention cross validation, pruning, cost-complexity
In addition to CART, these statistical and practical principals will be discussed • R programming. • Importance of exploratory data analysis. • Use trees to predict outcomes for newly collected data. • Graphical Comparison with regression. • Performance assessment on simulated data. • Importance of model validation (brief).
Collaboration: Visit our website to request personalized statistical advice and assistance with: Experimental Design • Data Analysis • Interpreting ResultsGrant Proposals • Software (R, SAS, JMP, SPSS...) LISA statistical collaborators aim to explain concepts in ways useful for your research. Great advice right now: Meet with LISA before collecting your data. Laboratory for Interdisciplinary Statistical Analysis LISA helps VT researchers benefit from the use ofStatistics LISA also offers: Educational Short Courses:Designed to help graduate students apply statistics in their research Walk-In Consulting: M-F 1-3 PM GLC Video Conference Room for questions requiring <30 mins Also 3-5 PM Port (Library/Torg Bridge) and 9-11 AM ICTAS Café X All services are FREE for VT researchers. We assist with research—not class projects or homework. www.lisa.stat.vt.edu
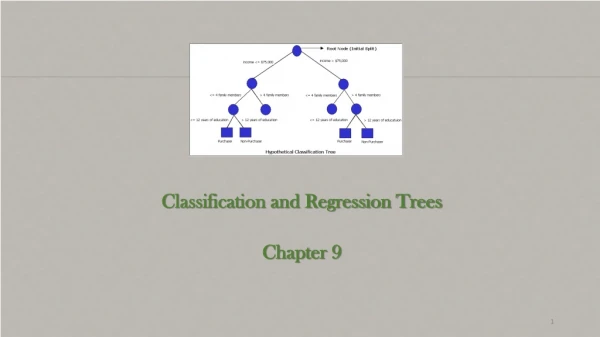
Tree-based methods • Imagine you have two predictor variables , , and you want to predict the outcome variable • may be continuous or categorical. • The idea behind CART is to split the predictor space into a number of regions based on such that is well-characterized in each region.
The above idea is simple, although some of the language surrounding CART can sound technical. • Classification: When is categorical, guessing category (using predictors) is referred to as classification. • Regression: when is continuous, characterizing average behavior of y as a function of predictors is known as regression. • Recursive binary partitioning: A technique to split the predictor space: Binary because we split it into two pieces, recursive because we do it over and over, and partition means that the resulting regions do not overlap and they cover entire predictor space.
Imagine the predictor space of and as a rectangular box. • The outcome variable is a third dimension coming towards you from the slides. • We want to split this rectange up into regions such that every regions does a good job characterizing .
Example 1 iris data • In Rstudio, type ‘?iris’ (no quotes) to open the help file on the iris data. Preceding built-in data objects or functions with ‘?’ in R opens the help file. • Install the ‘tree’ package • Tools -> Install Packages… -> type ‘tree’ -> click install • Open ‘CART course code’
Iris data review • Exploratory data analysis (e.g. graphical plots) is generally a good first step when you encounter a new data set. • We built and snipped a classification tree for irises, which had a misclassification rate of 2.667% (only 4 incorrect predictions) • We only used two predictors. (Would you have guessed based on EDA?) • Tree diagrams and wireframes can be useful ways to visualize the tree. • Tree diagrams work regardless of the number of variables used in the tree. • Wireframes work with 2 variables.
Tree splits are chosen to minimize Deviance at each step • Statistical deviance generally encapsulates the difference between two probability measures. • In CART, deviance measures the heterogeneity (e.g. misclassification, variability) at each node. • Classification trees: • Regression trees: • Where is index for terminal nodes, is index for data, indexes the classes in each leaf. (See skull, simulation examples for an illustration).
Another example – Tibetan skulls Description from Hand et. al. (1996).
Skull data review • We grew another classification tree • Predicted an outcome based on new data • Looked at deviance calculation
Under the hood • CART uses a greedy algorithm. • At each step the chosen split is the one which. maximizes classification/ minimizes error. • Similar to forward variable selection in regression. • The splitting continues until nodes become “too small” or deviance explained by a new split is small relative to starting deviance (see ‘?tree.control’ for more details)
Final two examples: Regression trees • Similar to classification trees but for continuous outcomes. • Simulated example – when we know the correct answer, does the method work? • Motor trend car data
Advantages of CART • Can be used to characterize outcomes as a function of many predictors • Simple, yet powerful. • Tree can be visualized easily in high dimension. • Classification is highly similar to regression in CART. (more similar than orginary least squares versus logistic regression in my opinion).
Caveats of CART • Trees tend to overfit data • We saw low classification error rates and good deviance performance for the data used to construct the tree. • Would the trees we built necessarily predict new irises, skulls, or cars as well? • Small changes to input data could result in major changes to tree structure (homework).
Cross validation is typically used to assess overfitting • K-fold cross validation: A technique which assesses the predictive value of a model (tree in this case) for new data. • Split the data into k (say 10) parts. • Withhold one part (validation set), grow the tree using other 9 parts (training set). • Assess predictive accuracy on the validation part using the tree. • Repeat, holding all 10 parts out in turn.
How big should the tree be? • Too big will overfit data • Too small might miss important structures • Generally, cost-complexity pruning can be used. • Make a big tree (say until no node has more than 5 observations) • Consider all subtrees which can be achieved by pruning the big tree. Choose tree which satisfies a cost-complexity criterion (see ?prune.tree in R, references for more detail).
Random Forests – another tree-based technique • Basic idea is to sample data with replacement (i.e. bootstrap sample). • 1/3 of each sample is left out. • 2/3 of data used to build a tree, then performance of tree determined based on hold-out data • Grow a large number of trees, each of which “votes” for a certain classification. • See http://www.stat.berkeley.edu/~breiman/RandomForests/cc_home.htm
References • The Elements of Statistical Learning: Data Mining, Inference, and Prediction. Hastie T, Tibshirani R, Friedman J. Second Edition 2009. • Morant GM. A First Study of the Tibetan Skull Biometrika, Vol. 14, No. 3/4 (Mar., 1923), pp. 193-260 • Discussion of “deviance” http://stats.stackexchange.com/questions/6581/what-is-deviance-specifically-in-cart-rpart • Hand DJ, Daly F, McConway K, Lunn D, Ostrowski E. A Handbook of Small Data Sets, Chapman and Hall 1996.