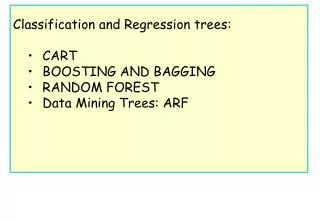
CART: Classification and Regression Trees
CART: Classification and Regression Trees. By Alyssa Dalton. Outline. Purpose of CART Background Why use CART? Splitting Rules Developing a Classification or Regression Tree Missing values. Purpose of CART.


CART: Classification and Regression Trees
E N D
Presentation Transcript
CART:Classification and Regression Trees By Alyssa Dalton
Outline • Purpose of CART • Background • Why use CART? • Splitting Rules • Developing a Classification or Regression Tree • Missing values
Purpose of CART • “The CART decision tree is a binary recursive partitioning procedure capable of processing continuous [regression] and nominal [classification] attributes as targets and predictors.” (Top ten algorithms) • Recursive: using a rule or procedure that can be applied repeatedly
Background • Classification and Regression Trees • Leo Breimen • Richard A. Olshen • Charles J. Stone • Jerome H. Friedman • UCSD Heart Disease Study
Why use CART? • Originally designed to mimic thought process of a doctor when diagnosing a patient • Easy to create tree (software creates tree using given data) • Easy to understand result
Splitting Rules • The Gini coefficient determines which variable to split node on. • G(t)= 1- p(t)2 – (1- p(t)) 2 • p(t) is the possibility of having 1 “class” in a node t. • The Gini coefficient ranges between 0 and 1. • Reaches a value of zero when only one class is present at a node • An instance goes left if CONDITION, and goes right otherwise.
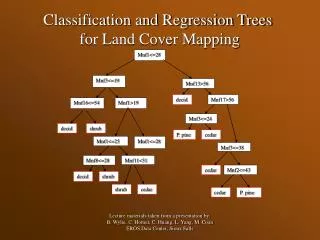
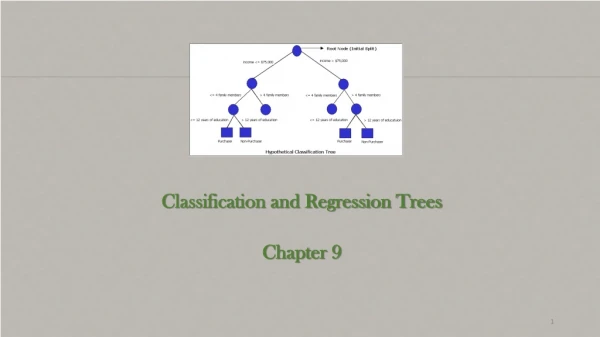
Developing a Classification or Regression Tree • Divide data into test and training sets • Root Node • Binary split using Gini- value closest to zero. • Entropy is an alternative • Continue to split until no other data is available. • Gives maximal tree. • Prune- using cross validation (test data) • gets rid of nodes that do not contribute to lowering error • Avoids overfitting • Gives optimal tree
Missing values • Surrogate split- if optimal splitting value is missing, the value with the “highest measure of predictive association” with the optimal value is used
Re-cap • Purpose of CART • Background • Why use CART? • Splitting Rules • Developing a Classification or Regression Tree • Missing values
sources • http://people.hofstra.edu/geotrans/eng/ch4en/meth4en/ch4m1en.html • http://www.statsoft.com/textbook/classification-and-regression-trees/#details • http://filipspagnoli.wordpress.com/2008/05/05/human-rights-facts-4/ • Dictionary.reference.com