Download
1 / 20
200 likes | 357 Views
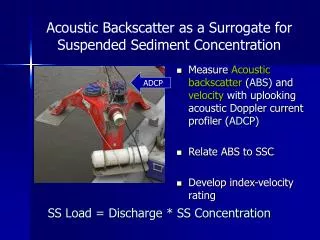
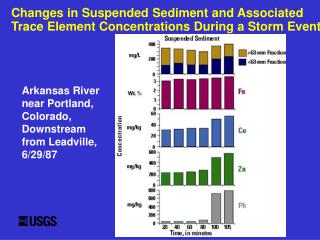
Changes in Suspended Sediment and Associated Trace Element Concentrations During a Storm Event. Arkansas River near Portland, Colorado, Downstream from Leadville, 6/29/87. USGS National Field Manual Available in Hard Copy or on the Web at: http://water.usgs.gov/owq/FieldManual/.

E N D
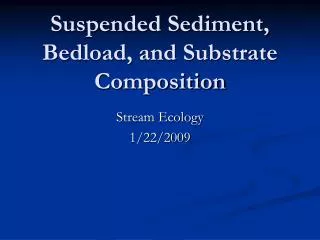
Changes in Suspended Sediment and Associated Trace Element Concentrations During a Storm Event Arkansas River near Portland, Colorado, Downstream from Leadville, 6/29/87
USGS National Field Manual Available in Hard Copy or on the Web at:http://water.usgs.gov/owq/FieldManual/
Total Phosphorous Concentration versus DischargeOhio River at Greenup Dam, KY, WY97 - 99
Total Phosphorous Load Estimates: by Sampling Frequency and MethodOhio River at Greenup Dam, KY, WY97 - 99 20% 10% 0% Ratio Estimation Regression -10% Difference in Load Estimate, in percent -20% -30% -40% -50% -60% Monthly+High Quarterly Bimonthly Monthly Sampling
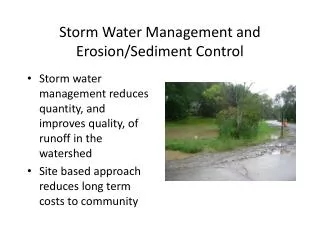
Key Components of Models • Point Sources • Areal Contributions • Ground water • Surface runoff • Atmospheric deposition • Transport Processes • Loss Processes
NADP-National Trends Network USGS Supported Sites Non-USGS Supported Sites
National Atmospheric Deposition Program • Interagency approach to environmental monitoring • Over 100 federal, state and local organizations sponsor sites • The USGS supports: • 73 of the 226 National Trends Network sites • 5 of the 56 Mercury Deposition Network sites Data at http://bqs.usgs.gov/acidrain
Key Components of Models • Point Sources • Areal Contributions • Ground water • Surface runoff • Atmospheric deposition • Transport Processes • Loss Processes
Streamflow Statistics • USGS regression equations • Large effort by users to determine basin characteristics accurately – need to make it efficient • Prototype system: Massachusetts Streamstats
Regression Equations • Regression equations take the form:Q100 = 0.471A0.715E0.827SH0.472 • Drainage area is used in nearly all equations • Other common variables include: • Basin slope, relief, or mean elevation • Precipitation (mean annual; 2-year, 24-hour) • Stream length or slope • Land use (forest, wetland, impervious, water) • Basin shape or orientation • Soils or surficial geology