Download
1 / 8
80 likes | 165 Views
Bellringer – Find IV for each. Procedure Pour 3 mL of yeast mixture into each test tube Weigh out 1 gram of sugar and 2 grams of sugar Pour the 1 gram of sugar into test tube 2 and the 2 grams of sugar into test tube 3. No sugar goes into test tube 1.

E N D
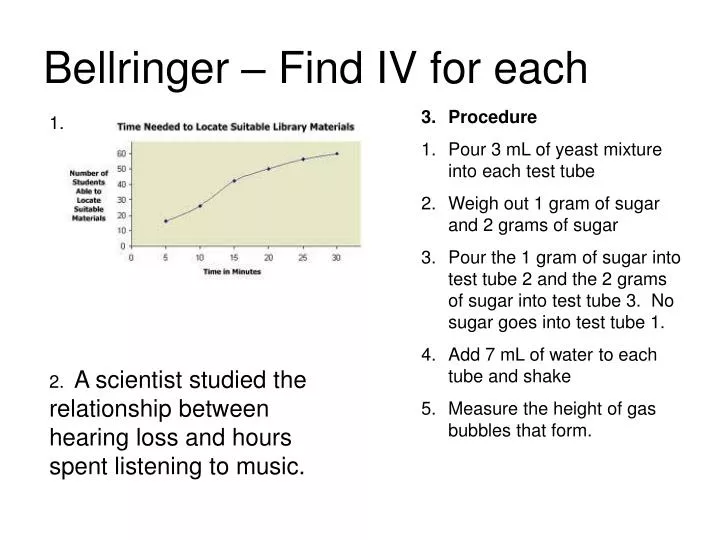
Bellringer – Find IV for each • Procedure • Pour 3 mL of yeast mixture into each test tube • Weigh out 1 gram of sugar and 2 grams of sugar • Pour the 1 gram of sugar into test tube 2 and the 2 grams of sugar into test tube 3. No sugar goes into test tube 1. • Add 7 mL of water to each tube and shake • Measure the height of gas bubbles that form. 1. 2. A scientist studied the relationship between hearing loss and hours spent listening to music.
Determine which is IV and label x-axis (then DV goes on y-axis) Decide if you need a squiggly (is your first value far from 0?) Put tick marks at each line Things to do in a scatter plot
Decide what to count by • Determine the range: high – low 719 – 447 = 272 • Determine the number of spaces We used 1 for the squiggly so there are 9 left • Divide 272 divided by 9 = 30+ so 30 won’t fit 4. Choose the next nice round number to make it easy to graph 5. Be sure to start with a number below your first value
Try it for y-axis • Range: 50 – 13 = 37 • 37 divided by 9 = 4+ so can’t use 4 • So go up to 5
Draw best fit line • Do not try to include 0!!! • Line should cut data in half