Download
1 / 27
270 likes | 292 Views
Unlock the role of inorganic polymers in nanominerals with mass spectrometry. Explore classical vs. non-classical nucleation, crystal growth, and solutes. Understand mineral periodicity and crystal alignment pathways.

E N D
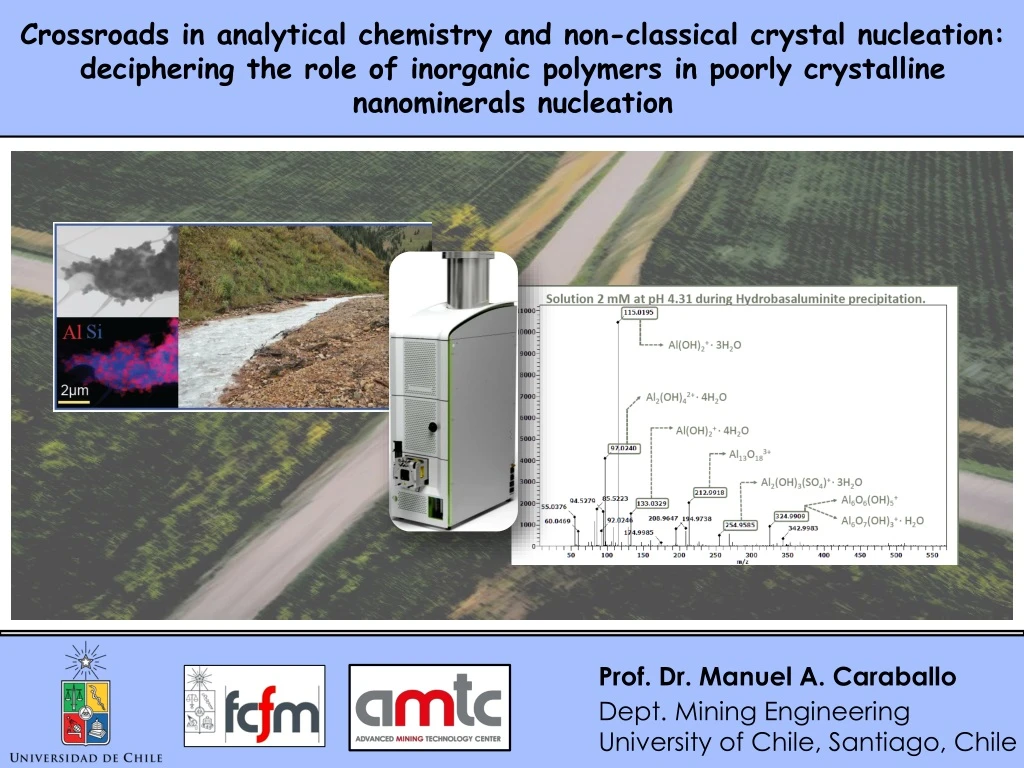
Crossroads in analyticalchemistry and non-classicalcrystalnucleation: decipheringthe role of inorganicpolymers in poorlycrystalline nanominerals nucleation Prof. Dr. Manuel A. Caraballo Dept. MiningEngineering University of Chile, Santiago, Chile
INTRODUCTION MASS SPECTROMETRY APPLICATION OF MASS SPECTROMETRY TO THE STUDY OF INORGANIC POLYMERS BENEFITS AND CURRENT LIMITATIONS OF USING MASS SPECTROMETRY TO STUDY INORGANIC POLYMERS HYDROBASALUMINITE CASE STUDY
INTRODUCTION Prof. Dr. Manuel A. Caraballo Dept. MiningEngineering University of Chile, Santiago, Chile
Classical vs Non-Classical Nucleation and Crystal Growth • Mineral Periodicity: can be understood as the nature of regularly appearing recurrent motifs as one moves through an atomic structure, and it is convenient to compartmentalize this regularity in terms of short-, medium-, and long-range order. • Short-range order, SRO: typically limited to periodicity that extends to the third nearest atomic neighbor (distances generally on the order of up to 0.5 to 0.6 nm) • Medium-range order, MRO: extends periodicity from the fourth to the tenth nearest neighbor (up to 2 to 3 nm, depending on bond lengths) • Large-range order, LRO: accounts for periodicity beyond the tenth nearest neighbor (distances generally higher than 3 nm) Wang et al., 2012, Science. Order from Disorder
Classical vs Non-Classical Nucleation and Crystal Growth Solutes ? Crystalline Nuclei CLASSICAL CRYSTAL GROWTH NON-CLASSICAL CRYSTAL GROWTH Primary Nanoparticle (>3nm) Nanoparticle alignment by spatial constraints Nanoparticle alignment by physical fields or mutual alignment of identical crystal faces Single Crystal Epitaxial growth of a nanoparticle employing a mineral bridge connecting the two nanoparticles Alignment of nanoparticles by an oriented organic matrix Songet al., 2010,AdvancedMaterials. Mesocrystals: OrderedNanoparticleSuperstructures
Classical vs Non-Classical Nucleation and Crystal Growth ? Oligomers Polymers Pathways to crystallization by particle attachment: In contrast to monomer-by-monomer addition as envisioned in classical models of crystal growth, CPA occurs by the addition of higher order species ranging from multi-ion complexes to fully formed nanocrystals. De Yoreo et al., 2015, Science. Crystallization by particle attachment in synthetic, biogenic, and geologic environments
Classical vs Non-Classical Nucleation and Crystal Growth ? Oligomers Polymers Schematic categorization of the natural progressive transition between amorphous and crystalline materials Caraballo et al., 2015, American Mineralogist. Therapidexpansionof environmentalmineralogy in unconventionalways: Beyondtheaccepteddefinitionof a mineral, thelatesttechnology, and usingnature as our guide
Classical vs Non-Classical Nucleation and Crystal Growth Resolution limits of some common techniques used in the measurement of mineral crystallinity. The progressive fading from gray to white marks the loss of resolution of the different analytical techniques in the figure. The need of a multi-technique characterization to properly understand complex mineral phases is shown in the dashed extended area by the use of schwertmannite as a proxy for polyphasic nanominerals (Caraballo et al., 2015, American Mineralogist)
MASS SPECTROMETRY Prof. Dr. Manuel A. Caraballo Dept. MiningEngineering University of Chile, Santiago, Chile
Mass Spectrometry Mass Spectrometry (MS)measures the atomic or molecular weight of a ion from the separation based on its mass to charge ratio (m/z) One of the MOST Routinely used Analytical Techniques Nobel Laureates
Mass Spectrometry Mass spectrometry (MS) is an analytical technique that ionizes chemical species and sorts the ions based on their mass-to-charge ratio (m/z). • A mass spectrum is a plot of the ion signal as a function of the mass-to-charge ratio. These spectra are used to determine: • The elemental or isotopic signature of a sample • The masses of particles and of molecules • Elucidate the chemical structures of molecules. Ketoprofeno 100 112,9784 253,0869 197,0515 (%) Mass Spectrometer Overview 0 Vacuum Chamber 250 0 200 300 150 m/z Ion Source Computer Detector MassAnalyser(s) Inlet Instrument control and data acquisition Counts number of ions for each m/z Separate ions by m/z and fragments ions Sample introduction Make gas phase ions Vacuumpumps
Mass Spectrometer Overview: Inlet VacuumChamber Ion Source Computer Detector MassAnalyser(s) Inlet Instrument control and data acquisition Countsnumber of ionsforeachm/z Separateionsbym/z and fragmentsions Sampleintroduction Make gas phaseions Vacuumpumps Syringepump HPLC / UHPLC
Mass Spectrometer Overview: Ion Source VacuumChamber Ion Source Computer Detector MassAnalyser(s) Inlet Instrument control and data acquisition Countsnumber of ionsforeachm/z Separateionsbym/z and fragmentsions Sampleintroduction Make gas phaseions Coulombic Explosions Raleigh Limit Reached Evaporation Vacuumpumps + + + + - + Desolvation Process and Ionization Mechanism - + + + + + + + + + - - - + + + - - + + - + + - - + + - + + - - - + + + + + + - + - - + + - - + + + + + - - + + + + - + + + - + + Capillary Droplet Rayleigh limit is the maximum charge a droplet can hold while maintaining its volume Among other parameters (e.g., pH) molecules ionization depends on the mobile phase composition and flow rate
Mass Spectrometer Overview: Ion Source VacuumChamber Ion Source Computer Detector MassAnalyser(s) Inlet Instrument control and data acquisition Countsnumber of ionsforeachm/z Separateionsbym/z and fragmentsions Sampleintroduction Make gas phaseions Vacuumpumps • Atmospheric Pressure Ionization (API) is a family of techniques which includeElectrospray (ESI) and Atmospheric Pressure Chemical Ionization (APCI), being the former the most commonly used ion source. Electrospray (ESI) • Solvent and sample are nebulized using a gas stream. • Small droplets are dried and undergo electrospray ion formation. • Ions in solution are desolvated and desorbed under the influence of high electrostatic fields.
Mass Spectrometer Overview: Mass Analyzer(s) VacuumChamber Ion Source Computer Detector MassAnalyser(s) Inlet Instrument control and data acquisition Countsnumber of ionsforeachm/z Separateionsbym/z and fragmentsions Sampleintroduction Make gas phaseions Vacuumpumps Quadrupole Ion trap (QTrap) Single quadrupole (SQ) Time of fligth (TOF) Triple quadrupole (QqQ)
Mass Spectrometer Overview: Detector Abundance Quantitative Information Qualitative Information VacuumChamber Ion Source Computer Detector MassAnalyser(s) Inlet Instrument control and data acquisition Countsnumber of ionsforeachm/z Separateionsbym/z and fragmentsions Sampleintroduction Make gas phaseions Vacuumpumps Mass Spectrometry Data Eg: Ketoprofen 100 112,9784 253,0869 197,0515 0 250 0 200 300 150 m/z
Mass Spectrometer Overview: Mass Analyzer(s) VacuumChamber Ion Source Computer Detector MassAnalyser(s) Inlet Instrument control and data acquisition Countsnumber of ionsforeachm/z Separateionsbym/z and fragmentsions Sampleintroduction Make gas phaseions Vacuumpumps Cost: ~ 0.1 2 ($M) m/z = 1000.00000 Quadrupole 50-200 ppm Ion Trap 10-100 ppm FTMS-ICR 0.05-1 ppm Time of Flight 1-50 ppm FTMS –IT (Orbitrap) 0.5-2 ppm
Mass Spectrometer Overview: mass accuracy and resolution Low end MS e.g. SQ High end MS e.g. TOF 301.0809 301.08 301.1 302.0811 302.08 303.1398 303.14 303.3 304.1516 304.15 C 15 H 14 Cl N 4 O C 16 H 14 Cl N 2 O 2 C 12 H 10 Cl N 8 C 14 H 18 Cl O 5 C 10 H 14 Cl N 6 O 3 C 21 H 14 Cl C 9 H 18 Cl N 2 O 7 C 6 H 10 Cl N 12 O C 15 H 14 Cl N 4 O C 16 H 14 Cl N 2 O 2 C 12 H 10 Cl N 8 C 14 H 18 Cl O 5 C 15 H 14 Cl N 4 O Increasing mass resolution Increasing mass accuracy
APPLICATION OF MASS SPECTROMETRY TO STUDY INORGANIC POLYMERS Prof. Dr. Manuel A. Caraballo Dept. MiningEngineering University of Chile, Santiago, Chile
Application of mass spectrometry to study inorganic polymers: “Chemical point of view” “Chemicalpoint of view” Cationic Spectrum Anionic Spectrum • 5mM solution of Al2(SO4)3·18H2O at pH3.76 was studied to examine the presence of inorganic polymers during sewage treatment (Fixed pH and concentration). • Database generation: Cationic and anionic polymers were assigned on the basis of the coincidence between measured and theoretical m/z values using whole numbers (No decimal figures) Sarpolaet al., 2007, Polyhedron. Hydrolysis products of water treatment chemical aluminiumsulfate octadecahydrateby electrospray ionization mass spectrometry
Application of mass spectrometry to study inorganic polymers: “Chemical point of view” “Chemicalpoint of view” • Database generation: Cationic polymers were assigned on the basis of the coincidence between measured and theoretical m/z values using whole numbers (No decimal figures). • More than one polymer can be assigned to the same m/z value. • The interaction between the polymers and the ionization source generate different “species” of the same polymer that following a Gaussian distribution curve that helps assigning an specific polymer. ESI-TOF mass spectrum (a) of purified Al13 flocculants. The inserted table indicates the Al species and the m/z values Feng et al., 2014, ES&T. MD Electrospray Ionization Time-of-Flight Mass Spectrum Analysis Method of Polyaluminum Chloride Flocculants
Application of mass spectrometry to study inorganic polymers: “Mineralogical point of view” “Mineralogicalpoint of view” NMR+ESI-MS Imogolite • Database generation (No decimal figures). • More than one polymer can be assigned to the same m/z value 27Al liquid-state NMR spectra of nanotube solutions at various stages of aging (25 ºC) and heating (95 ºC). “Integration of all of our results (using density functional theory) leads to the construction of the first molecular-level mechanism of single-walled metal oxide nanotube formation, incorporating the role of monomeric and polymeric aluminosilicate species as well as larger nanoparticles” Yucelenet al., 2010, JACS. Formation of Single-Walled Aluminosilicate Nanotubes from Molecular Precursors and Curved Nanoscale Intermediates
BENEFITS AND CURRENT LIMITATIONS OF USING MASS SPECTROMETRY TO STUDY INORGANIC POLYMERS Prof. Dr. Manuel A. Caraballo Dept. MiningEngineering University of Chile, Santiago, Chile
Benefits of using mass spectrometry to study inorganic polymers UNEQUIVOCAL ASSIGMENT OF POLYMERS Al(OH)2+·nH2O 1) Obtaining m/z values with 4 significant decimal figures using TOF mass spectrometry. Isotopic Distribution Pattern 2) Identify “Gaussian shapes” due to hydration/dehydration, protonation/deprotonation, … 3) Identify isotopic distribution patterns Caraballo et al., 2017. Un-Published data
Benefits of using mass spectrometry to study inorganic polymers RELATIVE ABUNDANCE Caraballo et al., 2017. Un-Published data Mass spectrometry allows knowing the relative abundance of the identified polymers. Subsequently, it makes possible to study the evolution (relative increase or decrease) of an specific polymer or set of polymers during an experiment QUANTIFICATION Molecules quantification require the use of known and stable calibrants to generate calibration curves. However, the continuous evolution and instability of the inorganic molecules involved in many nanominerals synthesis makes it impossible to quantify them
Current limitations of using mass spectrometry to study inorganic polymers POLYMERS STABILITY/FRAGMENTATION The ability to generate “daughter” fragments from parent molecules is of great benefit to identify complex organic molecules and therefore this phenomena is emphasized in some mass spectrometers arrangement. However, some uncontrolled fragmentation can occur in the ionization chamber and therefore some uncertainty of the real polymers in solution can be expected The existing information on inorganic polymers is very limited and it is disseminated in the scientific literature (Absence of compiled database) LIMITED INORGANIC POLYMER DATABASE
Current limitations of using mass spectrometry to study inorganic polymers TIME RESOLUTION Mass spectrometry (depending on the specific operational conditions of each instrument) typically show a time resolution of seconds or minutes Structures of iron monomers (a, b) and dimers (c, d, e) sampled at the ends of Molecular Dynamic Simulations. Red, O; green, Fe; gray, H; blue, Cl. Initial setup of the Small MD system 27Fe3+ + 81OH− + 391H2O (a), and snapshots of iron molecular clusters formed at different MD time: (b) 6.5, (c) 10.0, and (d) 55.3 ns. Zhang et al., 2015, J. of Physical Chemistry B. MD Simulation Study of the Early Stages of Nucleation of Iron Oxyhydroxide Nanoparticles in Aqueous Solutions