Download
1 / 25
250 likes | 270 Views
Learn about GIS hardware, software, data management, and methodologies for geographical information analysis. Explore GIS data types (vector, raster), coordinate systems, and real-world applications. Join us for interactive sessions on GIS tools and techniques.

E N D
Introduction to Geographic Information Systems (GIS) GH 706 Mixed Methods in Global Health Research 2/23/2017 Jeff Blossom, Center for Geographic Analysis Jblossom@cga.harvard.edu http://gis.harvard.edu
Our mission To support research and education that relies on geographic information.
CGA Help Desk • Where: • Cambridge CampusRm K-00A, Lower LevelKnafel Building , CGIS1737 Cambridge Street ,Cambridge, MA 02138and • Longwood CampusMicro Lab, Lower LevelKresge Building677 Huntington AvenueBoston, MA 02115 • Harvard Business School (only on the 3rd Wednesday of each month) Baker Library, Room 130 3 Soldiers Field Road, Boston, MA • When: • Tuesday, 1:30pm - 4:00pm • Email: • http://gis.harvard.edu/contactus CGA’s location at 1737 Cambridge St. The Cambridge Help Desk
What is GIS? Geographic Information System (GIS) defined: A collection of computer hardware and software designed for capturing,storing,updating,, manipulating,analyzing,displaying,andpublishingall forms of geographically referenced information. People performing different roles are required. Common methodologies are applied within a GIS.
What is GIS?(Geographic Information Systems) A pan-able and zoom-able map – so that little girl can see places above Argentina and Chile.
An intelligent map to answer your questions: What exist at the same location (overlay)?
An intelligent map to answer your questions: Where are the hot spots ?
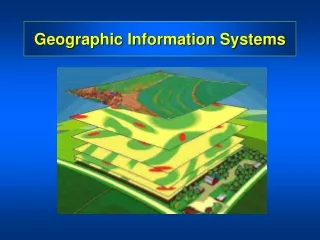
A spinning globe with elevated terrain– so to give you a realistic view of places on earth. … and more
GeographicCoordinate System – a common reference used to map things on Earth. • Use lines of longitude and latitude. • Any location on Earth can be represented by the intersection of a longitude, latitude line. 42.3744,-71.1166 is the latitude, longitude location of Harvard Yard
GeographicCoordinate System – a common reference used to map things on Earth. ** There are also other coordinate systems that use units of meters or feet instead of longitude and latitude **
Information is linked to features (like cities) on the map. • Stored in tabular form Geographic InformationSystems
Geographic Information System • Hardware- Software - Data - Methodology- People- Management A common set of tools and procedures A well managed system of information Database Data Files
GIS data types and file formats Fundamental GIS data types Raster Pixels Spatial Features GIS Data Points Vector Lines Polygons Tabular Attributes
Vector Representation of Geographic Features • Point: a pair of x and y coordinates • Line: a series of points connected together • Polygon: a line enclosed from end to end Examples: Point: cities Line: roads Polygon: states
Attribute tables store information about the geographic features. Vector GIS data Lines – U.S. Interstates Points – U.S. Cities Polygons – U.S. States
Raster Representation of Geographic Features • Point - one pixel • Line - a number of neighboring pixels strung out in a given direction • Polygon - an aggregation of neighboring pixels
Raster Data • Each pixel has a value • If the raster on the right represents land cover, the values might be: 1 = water (colored blue) 2 = forest (dark green) 3 = desert (dark brown) etc… • Scanned maps like the historic one on the right, and satellite image below it are raster.
Vector and raster file formats Raster • .tif – may also be accompanied by a .tfw • .jpg with a .jgw • .png with a .pgw • .img, .sid, .BIL, Esri Grid • There’s many more Vector • Shapefile: A collection of files with a .shp, .shx, .dbf, .prj (and possibly more) extension • .kml – Google Earth geographic data file. • .gdb – ESRI geodatabase. • There’s many more
Vector and raster data In general: • Vector is used to represent discrete features that do not completely cover the Earth’s surface like roads, trees, buildings, etc. • Raster is used to represent broad, continuous features that cover the entire Earth’s surface like elevation, precipitation, tempature, land cover, and imagery.
Early Example of Geographic Analysis Cholera Outbreak Map, Dr. John Snow (1854) London neighborhood
Snow’s Analysis • Two competing theories • Popular - Vapors from bubonic plague victims in old cemetery (green box) • Snow - contaminated water from wells (black rectangles)
Snow’s Analysis • Add locations of cholera deaths (red dots)
Snow’s Conclusion • Correlate victim’s home to source of drinking water • See majority get water from same pump (Broad St) • Find sewer pipes leaking into well • Shut well, big drop in cholera deaths
Thank you! Questions? Contact the CGA: http://gis.harvard.edu/contactus CGA website: http://gis.harvard.edu